
Blogs

Plenty of Peneplains?


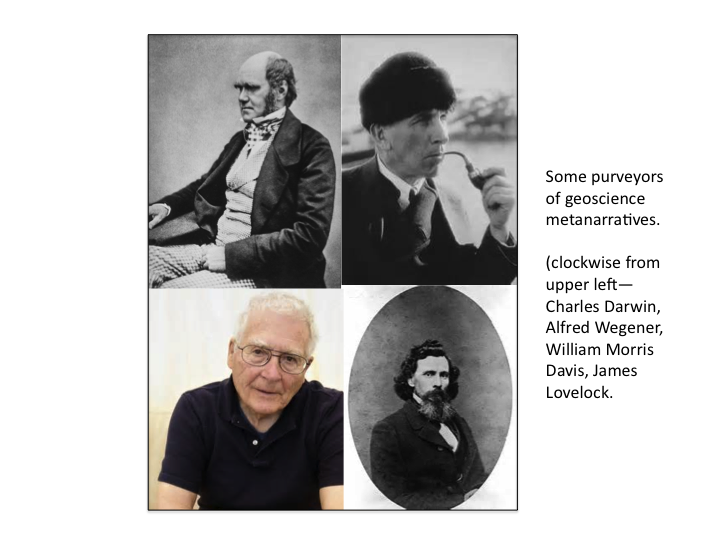
In the late 19th and early 20th century, William Morris Davis popularized the concept of the peneplain, an extensive low-relief erosion surface graded to sea level. Peneplains were strongly associated with Davis’ cyclical model of landscape evolution, which fell out of favor with most geomorphologists decades ago. By association, the discussion and study of peneplains also fell out of favor.

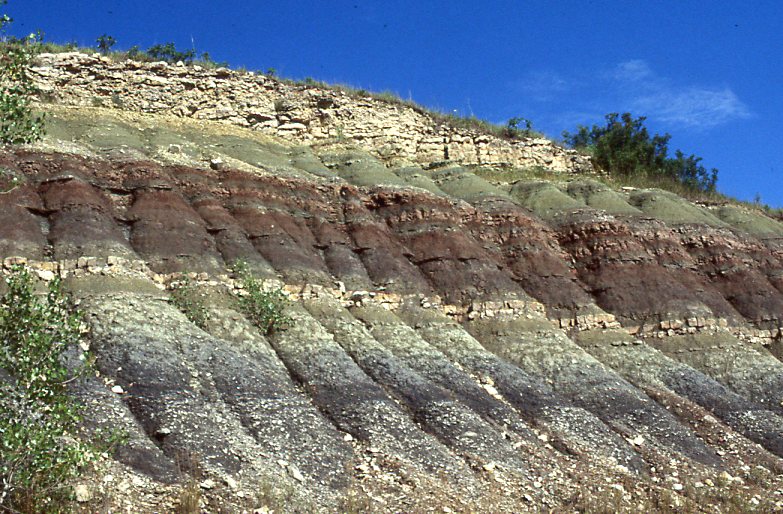
But peneplains are making a comeback. This is best illustrated by a report from the Geological Survey of Denmark and Greenland (Green et al., 2013), though the ideas and evidence are also laid out in a number of journal articles by the various co-authors. The report is concerned with development of elevated passive continental margins (think of, e.g., the Great Escarpment of Africa, the eastern Australian highlands, or the main subject of the report, west Greenland). The arguments are strongly dependent on the identification and interpretation of planation surfaces. As these planation surfaces are low-relief, regionally extensive, and are eroded across geological materials of varying resistance, and because the authors present evidence that they were originally graded to sea-level (they were subsequently uplifted), they can be legitimately referred to as peneplains.

Froude for Thought

The Froude number is a hydraulic parameter often used to relate aquatic habitats and biotopes to flow intensity. Independently of some trenchant critiques (see, e.g., Clifford et al. 2006), there seems to be no inherent hydrological, geomorphological, or ecological reason that the Froude number (Fr) should be the best indicator of habitat or ecological niches.

Fr is a dimensionless number that describes flow regimes in open channels and is unquestionably useful in many aspects of hydrology, geomorphology, and engineering. It is the ratio of inertial and gravitational forces:

Fr = V/(g d)0.5

Fr < 1 indicates subcritical or tranquil, and Fr > 1 supercritical or rapid flow. But variations in Fr within the subcritical range (where it typically falls) can be significantly related to, e.g., geomorphic units and habitats within channels.

Shawnee Run, Kentucky

Geoscience Metanarratives -- Part 2


This is a continuation of a previous post, and this one will be even less intelligible unless you read that one first.

So, even though we rarely use the term, geoscientists have our metanarratives. Metanarrative is something of a perjorative for postmodern (pomo) critical social theorists, but just because because a metanarrative doesn’t really explain everything, even within its domain, doesn’t make it wrong, useless, or even hubris-y. As long we don’t make claims or insinuations, or have expectations, of a “theory of everything,” overarching theories or explanatory frameworks can be evaluated on their own merits or lack thereof—that is, whether a construct can be considered a metanarrative or not is independent of its utility and value.

Geoscience Metanarratives


At my job I am housed in a building occupied mostly by social science and humanities scholars, many of whom are postmodern, post-structuralist, “critical” social theory oriented. The “critical” is in quotes not to cast aspersions, but because these folks use the term somewhat differently than do scientists, for whom all well-conceived legitimate work is critical in the sense of skepticism, testability, and the potential for falsification.  Anyway, my office location ensures that I am exposed to a good deal of the concepts and jargon of that community.

One of those is metanarrative. According to the Sociology Index web site:

Soil Erosion and Climate Change


A lot of us in the geoscience business are concerned these days with interpreting ongoing and past, and predicting future, responses of landforms, soils, and ecosystems to climate change. As one of my interests is rivers, I have noted over the years that in a lot of the literature on paleohydrology the major changes, such as major influxes of sediment, seem to occur at climate transitions, rather than after climate changes or shifts have had a chance to settle in and exert their impacts for awhile.

A related issue is the relationship between precipitation, temperature, runoff, erosion, and vegetation. As climate changes both temperature and precipitation regimes change. And as every physical geography student knows, moisture availability is not just about precipitation, but the balance between precipitation and evapotranspiration (ET). So, if both temperature and precipitation are increasing (as is the case on average on much of the planet now), whether available moisture increases or decreases depends on the relative increases of precipitation and ET.  

Soil erosion on cropland.

Strat-and-Transition Models II

This is a continuation of my earlier post on applying state-and-transition models (STM) to stratigraphic information, to account for the missing bits.

Barrell’s (1917) explanation of how oscillatory variations in base level control the timing of deposition. Sedimentation can only occur when base level is actively rising. These short intervals are indicated by the black bars in the top diagram. The resulting stratigraphic column, shown at the left, is full of disconformities, but appears to be the result of continuous sedimentation. Noted sedimentologist Andrew Miall has used this example in several articles to illustrate the problems of gaps in sedimentary & stratigraphic records.

Strat-and-Transition Models


The reconstruction of past environmental change is more important than ever. First, we look for precedents, principles, and lessons from the past as we try to understand and predict ongoing and future environmental change based on the fundamental wisdom that “if it did happen, it can happen.” Second, all kinds of new ideas on the coevolution of life, landforms, climate, and Earth itself need testing, verification—and maybe most importantly—hypothesis generation from the historical record.

The most important historical records for all but the past couple of centuries are stratigraphic. Environmental change is recorded in the sedimentary rock record, in geologically modern sedimentary deposits, and in soil layers. However, geoscientists have long realized that the stratigraphic record is incomplete—“more gap than record,” Derek Ager famously pointed out, with the preserved events equally famously termed “frozen accidents.” The current state of affairs is well summarized in and recently published volume titled Strata and Time: Probing the Gaps in Our Understanding (Smith et al., 2015).

Graph Theory in Geosciences

Wolfgang Scwhanghart, Tobias Heckmann and I have collaborated recently to review applications of graph theory in geomorphology and the geosciences in general. One of our papers, Graph Theory in the Geosciences, was just published in Earth-Science Reviews. The abstract is below. Our other joint paper, dealing specifically with graph theory applications in geomorphology, is still in press (in the journal Geomorphology) even though it was completed and accepted before the ESR paper. Go figure. 

Resources and Biodiversity

What is the relationship between the diversity of resources (e.g., space, sunlight, water, nutrients) and biodiversity? In most cases it is direct and positive—that is, the greater the diversity of resources the greater the biodiversity.  The relationship is also often mutually reinforcing—that is, byproducts, detritus, and the organisms themselves increase the diversity of the resource base. Of course, ultimately both resource and biodiversity are limited by both abiotic and biotic controls. The relationships look something like this: