The Froude number is a hydraulic parameter often used to relate aquatic habitats and biotopes to flow intensity. Independently of some trenchant critiques (see, e.g., Clifford et al. 2006), there seems to be no inherent hydrological, geomorphological, or ecological reason that the Froude number (Fr) should be the best indicator of habitat or ecological niches.
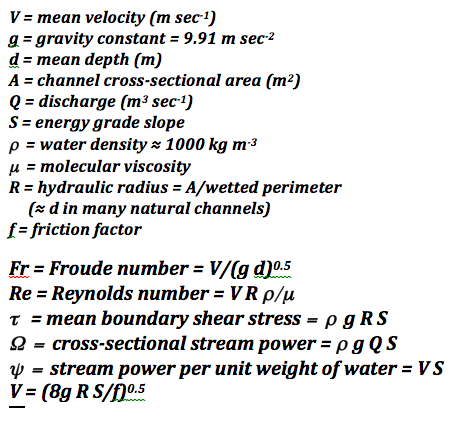
Fr is a dimensionless number that describes flow regimes in open channels and is unquestionably useful in many aspects of hydrology, geomorphology, and engineering. It is the ratio of inertial and gravitational forces:
Fr = V/(g d)0.5
Fr < 1 indicates subcritical or tranquil, and Fr > 1 supercritical or rapid flow. But variations in Fr within the subcritical range (where it typically falls) can be significantly related to, e.g., geomorphic units and habitats within channels.

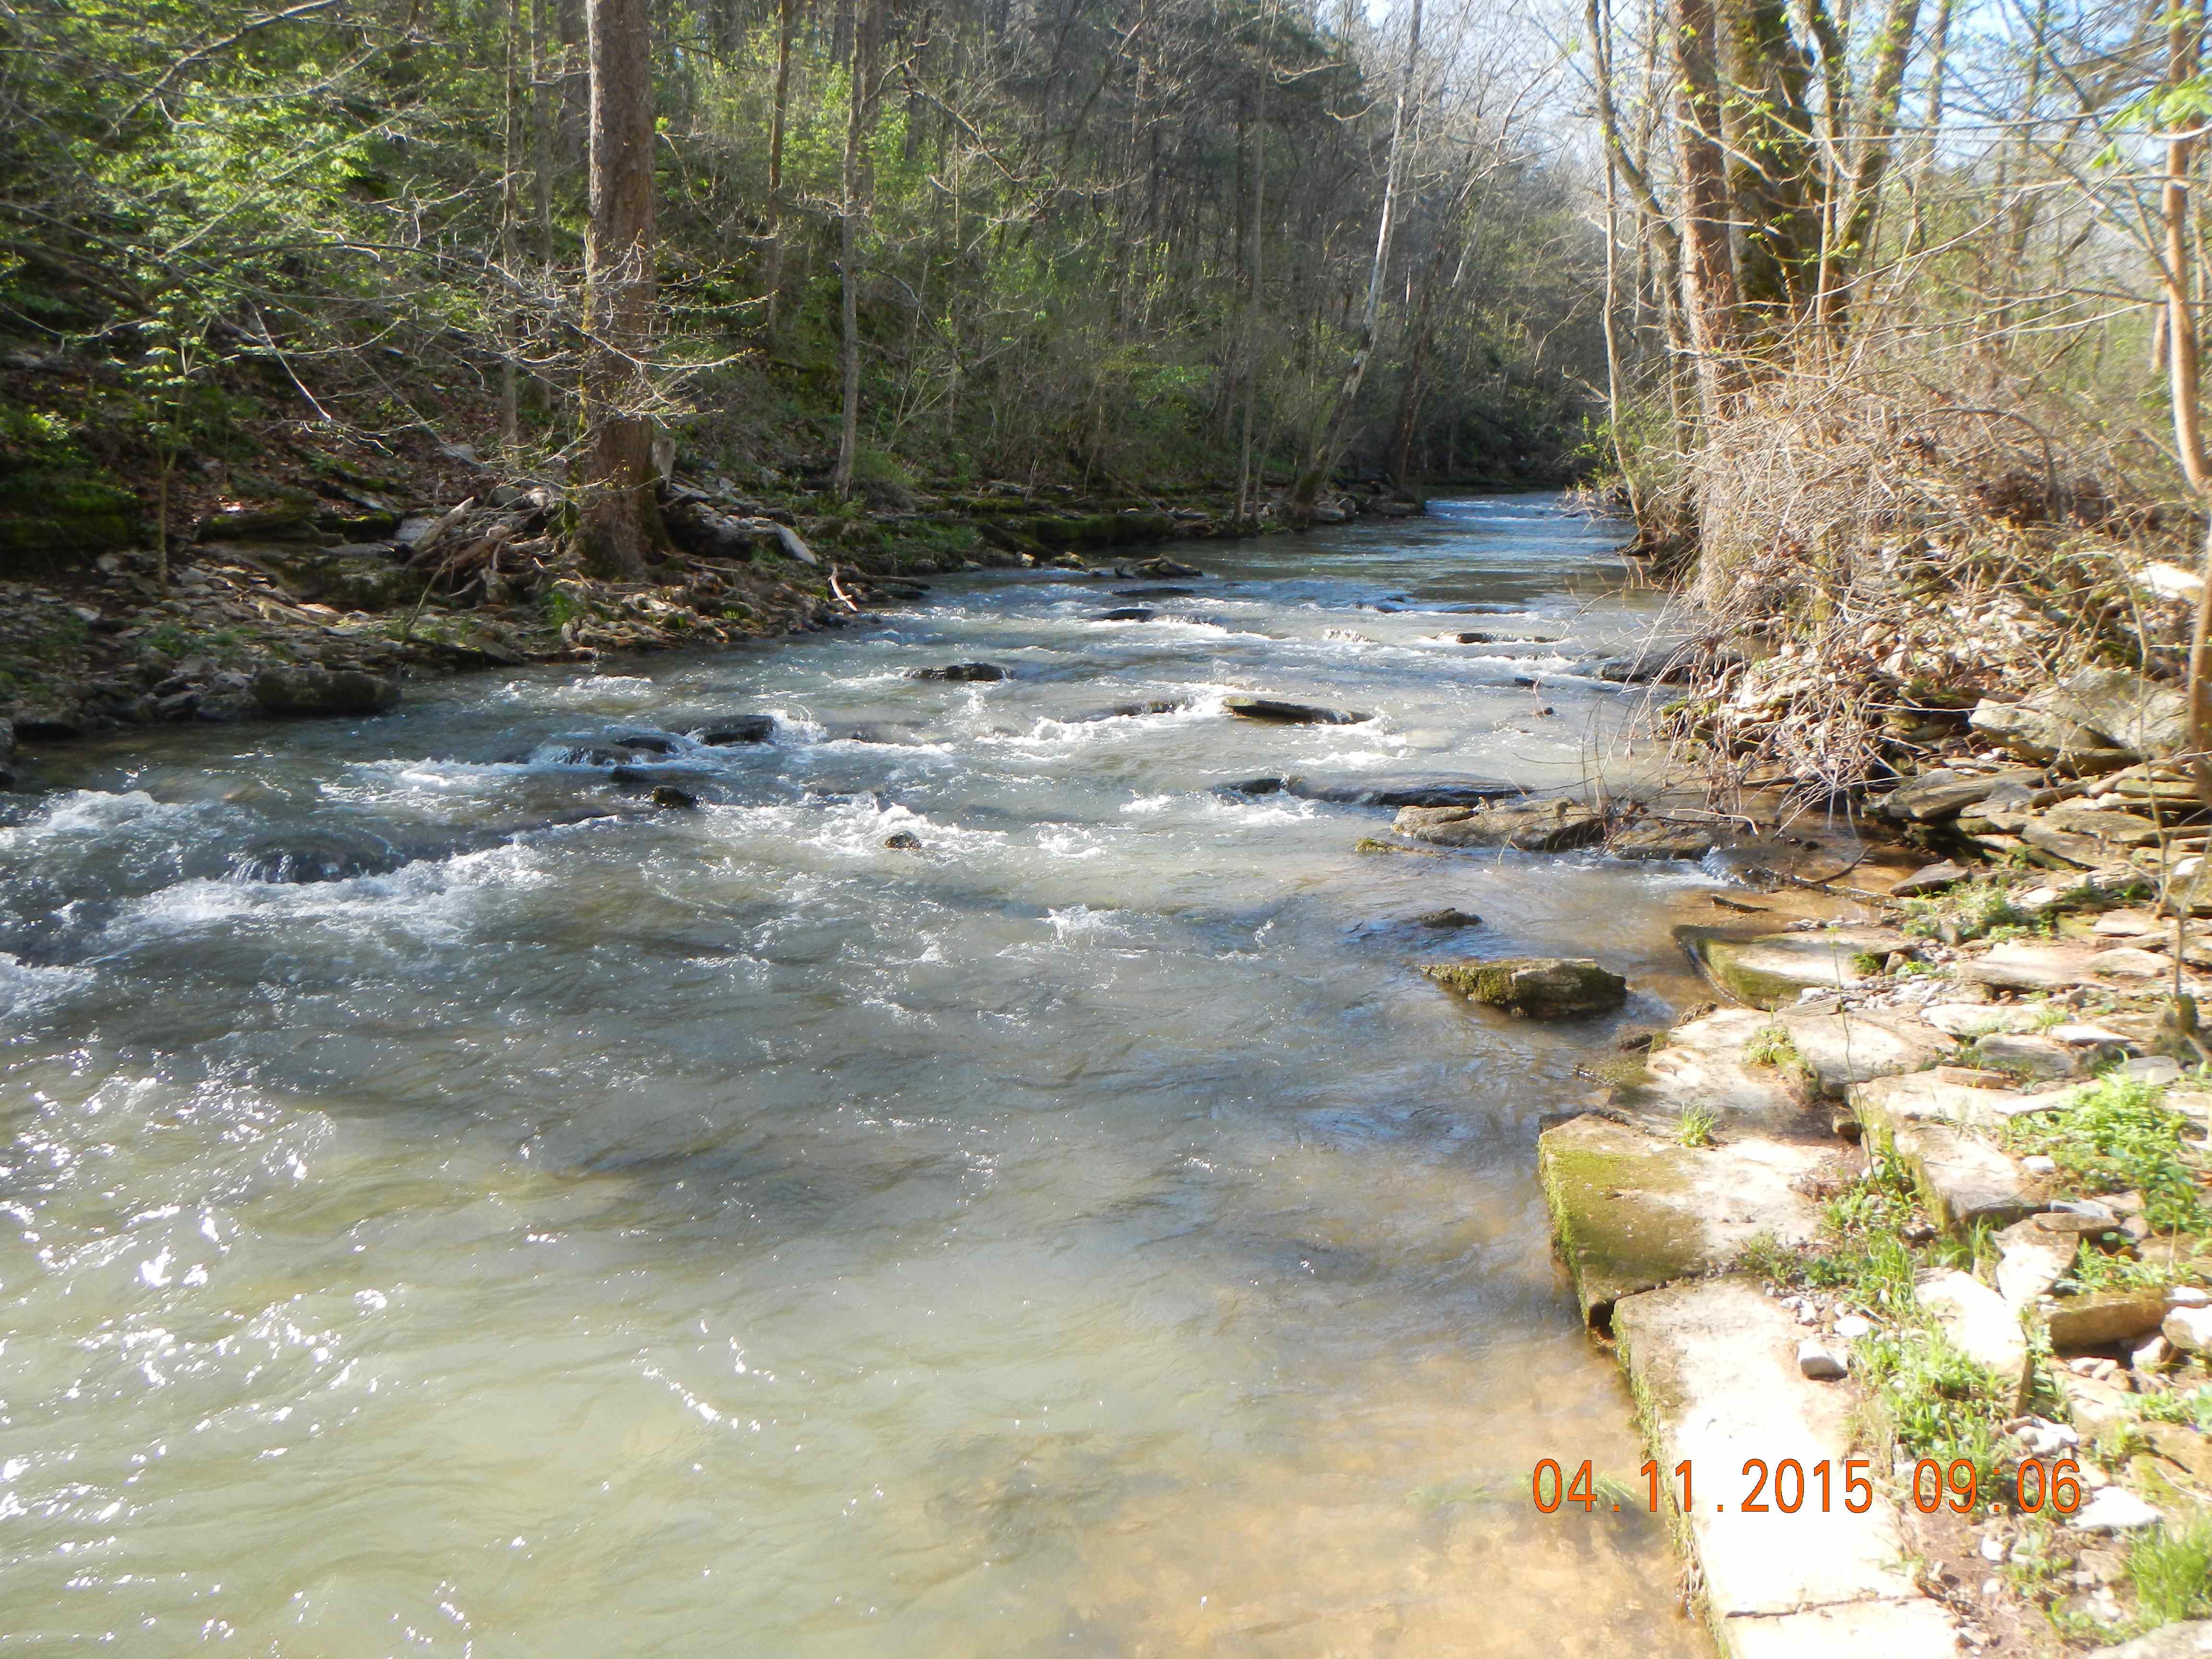
Shawnee Run, Kentucky
But what about other potential indicators? The Reynolds number (Re) is a measure of flow turbulence, shear stress (t) measures force exerted against channel boundary, and stream power indicates the rate of work or energy expenditure of flow. All of these, along with velocity or discharge, would seem to be as good or better indicators. So why is Fr so commonly employed?
If you take a look at the equations below, you can see that Fr varies directly and proportionately with velocity, and as the negative 0.5 power of depth. Reynolds number varies directly with V and d, and shear stress directly with d and slope. The stream power measures vary directly and proportionally with S and either V or Q. Thus, as flow conditions vary from wetter to drier periods and low to high flows, the Froude number is likely to be less variable than the other parameters. Thus, we can hypothesize that Fr is a preferred habitat indicator because it is more consistent.

My fluvial geomorphology class this semester tested this idea using field measurement data from U.S. Geological Survey gaging stations. These data include measurements of Q, V, channel width, and cross-sectional area. From these mean depth and the Froude number can be derived. They compared the coefficient of variation (mean divided by standard deviation) of Fr to that of discharge (related to cross-sectional stream power), V (related to Re and unit stream power as well as Fr) and d (related to Re and shear stress). A higher coefficient of variation (CV) for Froude number supports the notion that Fr is a preferred indicator because it is more consistent.
The students chose gaging stations representing a variety of fluvial settings, including bedrock-controlled, fluviokarst and alluvial channels; and high-gradient mountain and low-gradient coastal plain streams. Here’s what they found:
South Elkhorn Creek, Kentucky: The CV of Fr was greater than that for Q, d, and V for eight of the rating curves included in the data, with mixed results for three others.
Elkhorn Creek, Kentucky: : The CV of Fr was greater than that for Q, d, and V for all rating curves.
Dix River, Kentucky: The CV of Fr was greater than that for Q, d, and V for all rating curves.
Upper Cumberland River, Kentucky: The CV of Fr was greater than that for Q, but less than the CV of V and d.
Clear Fork, Kentucky: The CV of Fr was greater than that for Q, but less than the CV of V and d.
Cheat River, West Virginia: The CV of Fr was greater than that for Q, d, and V for all rating curves.
Lower Waccamaw River, South Carolina: The CV of Fr was greater than that for Q, and V and less than for d, for all rating curves. This site is tidally influenced, and d is almost constant as a consequence (less than 1 m variation for the entire data set).
Savannah River, Georgia/South Carolina (two stations near Augusta, GA): The CV of Fr was greater than that for Q, d, and V for six rating curves, and lower than Q, d, V for one rating curve.
Lower Colorado River, Texas (Bastrop): CV of Fr was greater than that for Q, d, but less than that of V for all rating curves.
Lower Colorado River, Texas (Bay City): The CV of Fr was greater than that for Q, d, and V for all rating curves.
Overall, results support the hypothesis that Froude number is less variable at a given location than other hydraulic indicators. Clifford et al. (2006) noted that different combinations of V and d could produce the same Froude number, and this was evident at many of the sites above. Many sites show bimodal relationships (i.e., two distinct trends) in relationships between Fr and V, Q, or d.
The data were also mostly low Fr. No value higher than Fr = 0.7 was recorded at any time at any station, and most values were less than 0.4 (many much less). Thus, sampling at smaller, steeper sites during high flows would be advisable for any future studies along these lines.
The students in the class who did the analyses are: Kornelia Wielisczko, Wisam Muttashar, Marielle Manning, Wei Ji, Jeremy Eddy, Sidney Dobson, and Darion Carden.
---------
Clifford, N.J., Harmar, O.P., Harvey, G., Petts, G.E., 2006. Physical habitat, eco-hydraulics and river design: a review and re-evaluation of some popular concepts and methods. Aquatic Conservation: Marine & Freshwater Ecosystems 16: 389-408.
