
River and stream bank erosion is normally assessed—including studies I was involved in--by reaches. That is, the erosional (or stable or accreting) status is assessed along sample reaches of a certain length (e.g., 100 m long segments), or lengths of shoreline are classified—e.g., a 40 m erosional stretch, a 120 m stable stretch, 30 m accreting length, etc. Or, where rates are measured, they are presented (not illogically) as mean or characteristic values for a reach. They are also generally averaged over time—so, for example, if the bank retreated 1 m in a decade, a rate of 0.1 m yr-1 is reported. Again, in many cases that is entirely reasonable, as (depending on the study design) there is often no way of knowing for sure if the erosion occurred at a more-or-less steady rate, all in one flow event, or somewhere in between. For some alluvial streambanks, there also exists uncertainty as to whether the observed retreat represents nothing but erosion, as opposed to net erosion—for instance, 1.5 m of retreat over 10 years, offset by 0.5 m of accretion somewhere during that time.
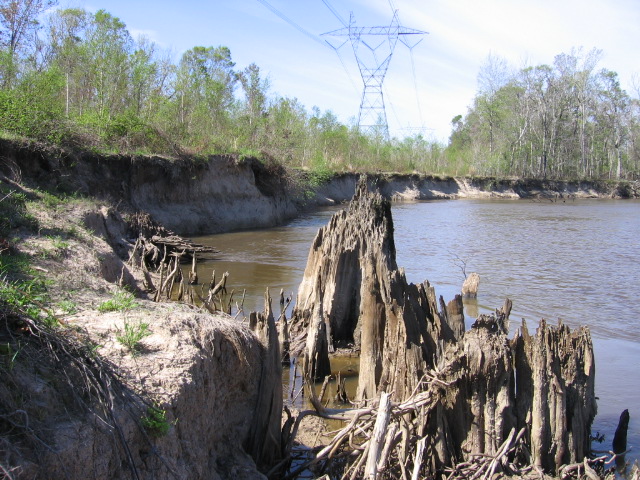
Eroding banks, Old River, Louisiana.
A recent e-mail exchange with a fluvial geomorphologist colleague got me thinking about this. He pointed out that in his data, which overcomes the main limitations above, shows many years of zero erosion even along banks undergoing general long term erosion, and often very little relationship between erosion and the magnitude of flood events.
Geomorphic change is often episodic, with long periods of little or no change interrupted by episodes of sometimes rapid change, so that aspect is not entirely surprising (though many banks undergoing long term net erosion certainly appear to be consistently vulnerable—for example where weak bank material on a steep slope with limited vegetation cover or debris protection is exposed). Disproportionate responses to forcing events are also well known in fluvial geomorphology—that is, big floods with limited geomorphic impacts and smaller flows with disproportionately large impacts. And complex responses and high degrees of local spatial variability are also widely recognized in fluvial geomorphology.
Indian Bayou, Texas, showing different dominant modes of bank erosion on opposite banks, and local variations in morphology and apparent retreat on both sides.
We know that in addition to the magnitude of a flood event (the discharge, stream power, etc.), the timing and sequence of events and the resisting framework are important in determining impacts—and even at a single point on a stream bank the latter may change as bank vegetation, woody debris, and morphology change. We also know that thresholds are important—for instance, if a stream bank has developed an overhang that is near its critical failure point, it may not take much to initiate a collapse.
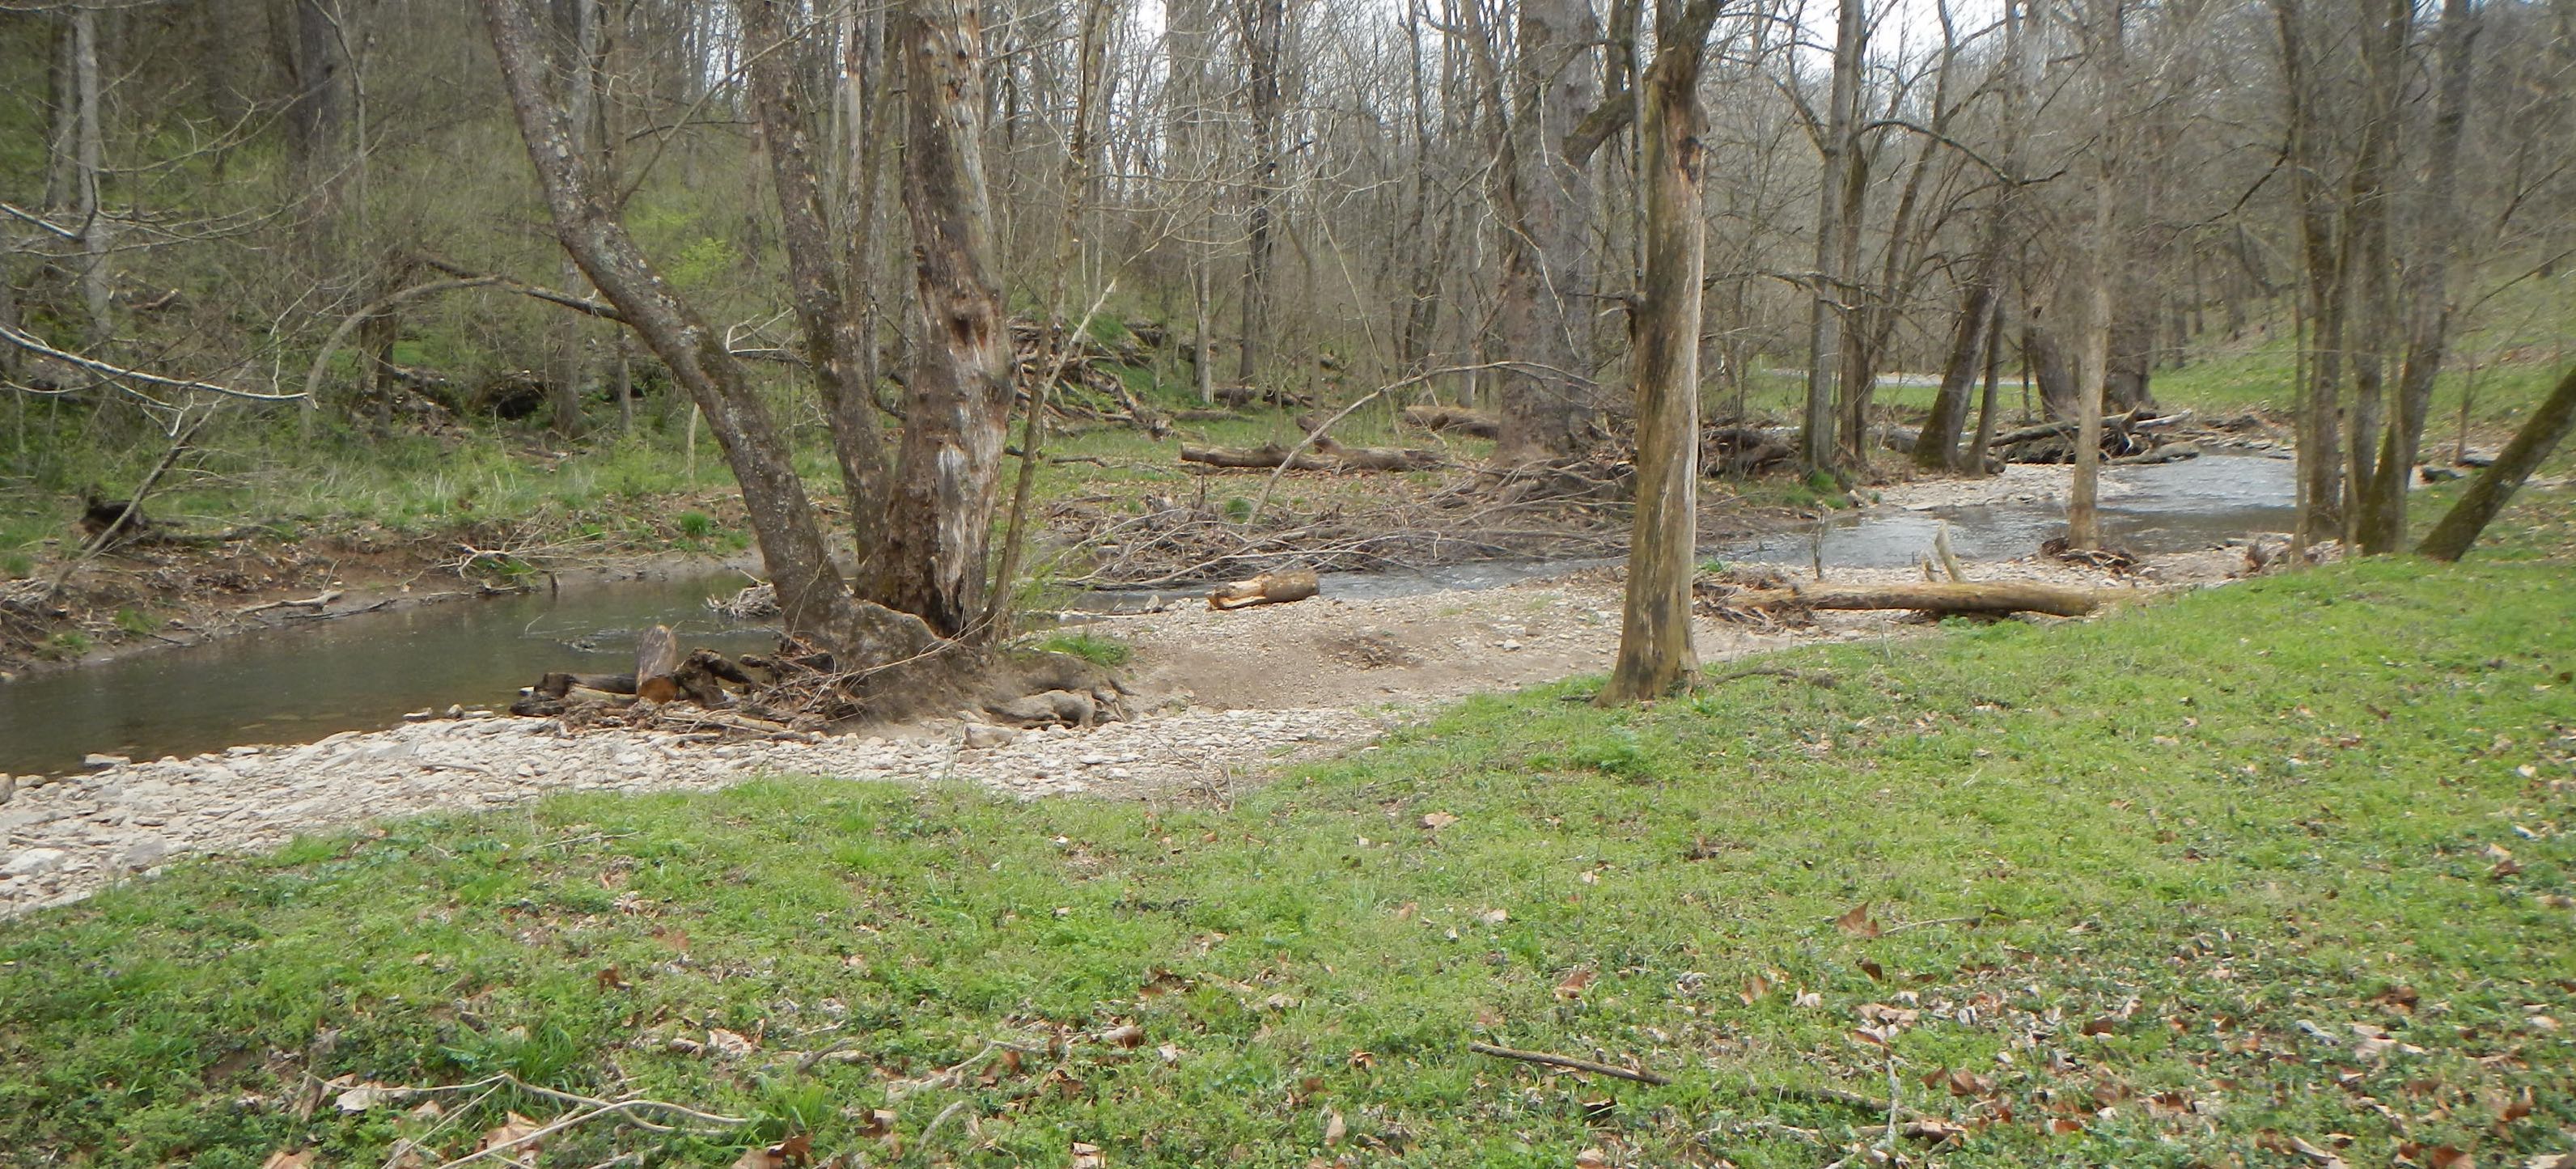
Reach of Shawnee Run, Kentucky showing banks with evidence of erosion, accretion, stability, and erosion-recovery within a small area.
The upshot is that rates of bank erosion (or other change) and aspects of bank morphology, vegetation, etc. tend to be highly spatially complex, with a great deal of local variability over short distances. Fonstad and Marcus (2003) found that the distribution of bank failure sizes conforms to self-organized criticality (SOC). The power-law size-frequency distributions that are the signature of SOC can arise from several different causes, but Fonstad and Marcus (2003) linked their findings to complex nonlinear dynamics among the processes and controls of bank erosion. Croke et al. (2015) found the evidence for SOC in bank failures following a major flood to be equivocal, but with clear evidence of nonlinear dynamics, high spatial variability, and disproportionate responses relative to the magnitude of events. They also noted that defining a critical state is no easy tasks when multiple modes of adjustment and numerous feedbacks are present.
So, I did what I do—a combination of abstract theory and muddy-boots field evidence. The figure below represents the interactions among key factors. Watershed runoff represents the supply of water to the stream system, a function of the hydroclimatic water balance and runoff response. This considers not only runoff that appears as channel flow (discharge), but also as local runoff across stream banks (riparian runoff) and groundwater in the vicinity of banks (pore water pressure). The vegetation factor includes with living vegetation and woody debris and relict stumps and roots that affect hydraulic roughness, bank morphology, and resistance (e.g. shear strength).
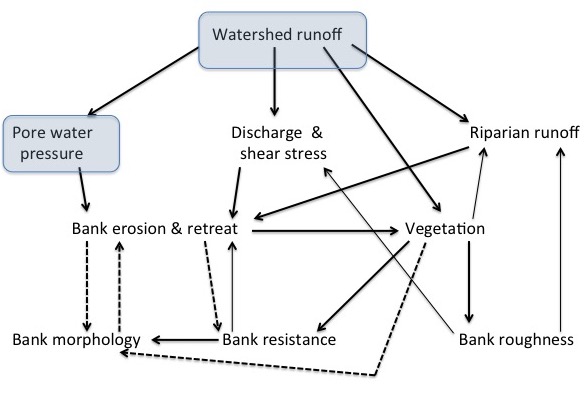
Interactions among key factors in stream bank erosion. Watershed runoff and pore water pressure are highlighted because they are external factors in that they do not directly influence system stability. Thicker arrows indicate positive links (an increase or decrease in the source component leads to a change in the same direction in the other component), and thinner arrows negative links (increases or decreases have inverse effects). Dotted arrows indicate effects that may be either positive or negative with respect to bank erosion.
This kind of model can be assessed using the Routh-Hurwitz criteria to assess its dynamical stability, based on the eigenvalues of the interaction matrix. I analyzed the matrix for the system shown here, using various combinations of negative and positive for the dotted-line arrows. The bottom line is that there is no dynamically stable configuration, even under various assumptions of relative strengths of various lengths, and assuming that some components have stability-increasing self-limiting affects (not shown on the diagram for the sake of clarity).
This dynamical instability implies that following a change to any component—e.g., erosion or deposition that modifies bank morphology; addition or removal of vegetation or woody debris; changes in resistance or riparian runoff response due to creation or exposure of different materials or surfaces—the stream bank system is unlikely to return to its previous state. Dynamical stability also implies sensitivity to variations in initial conditions.
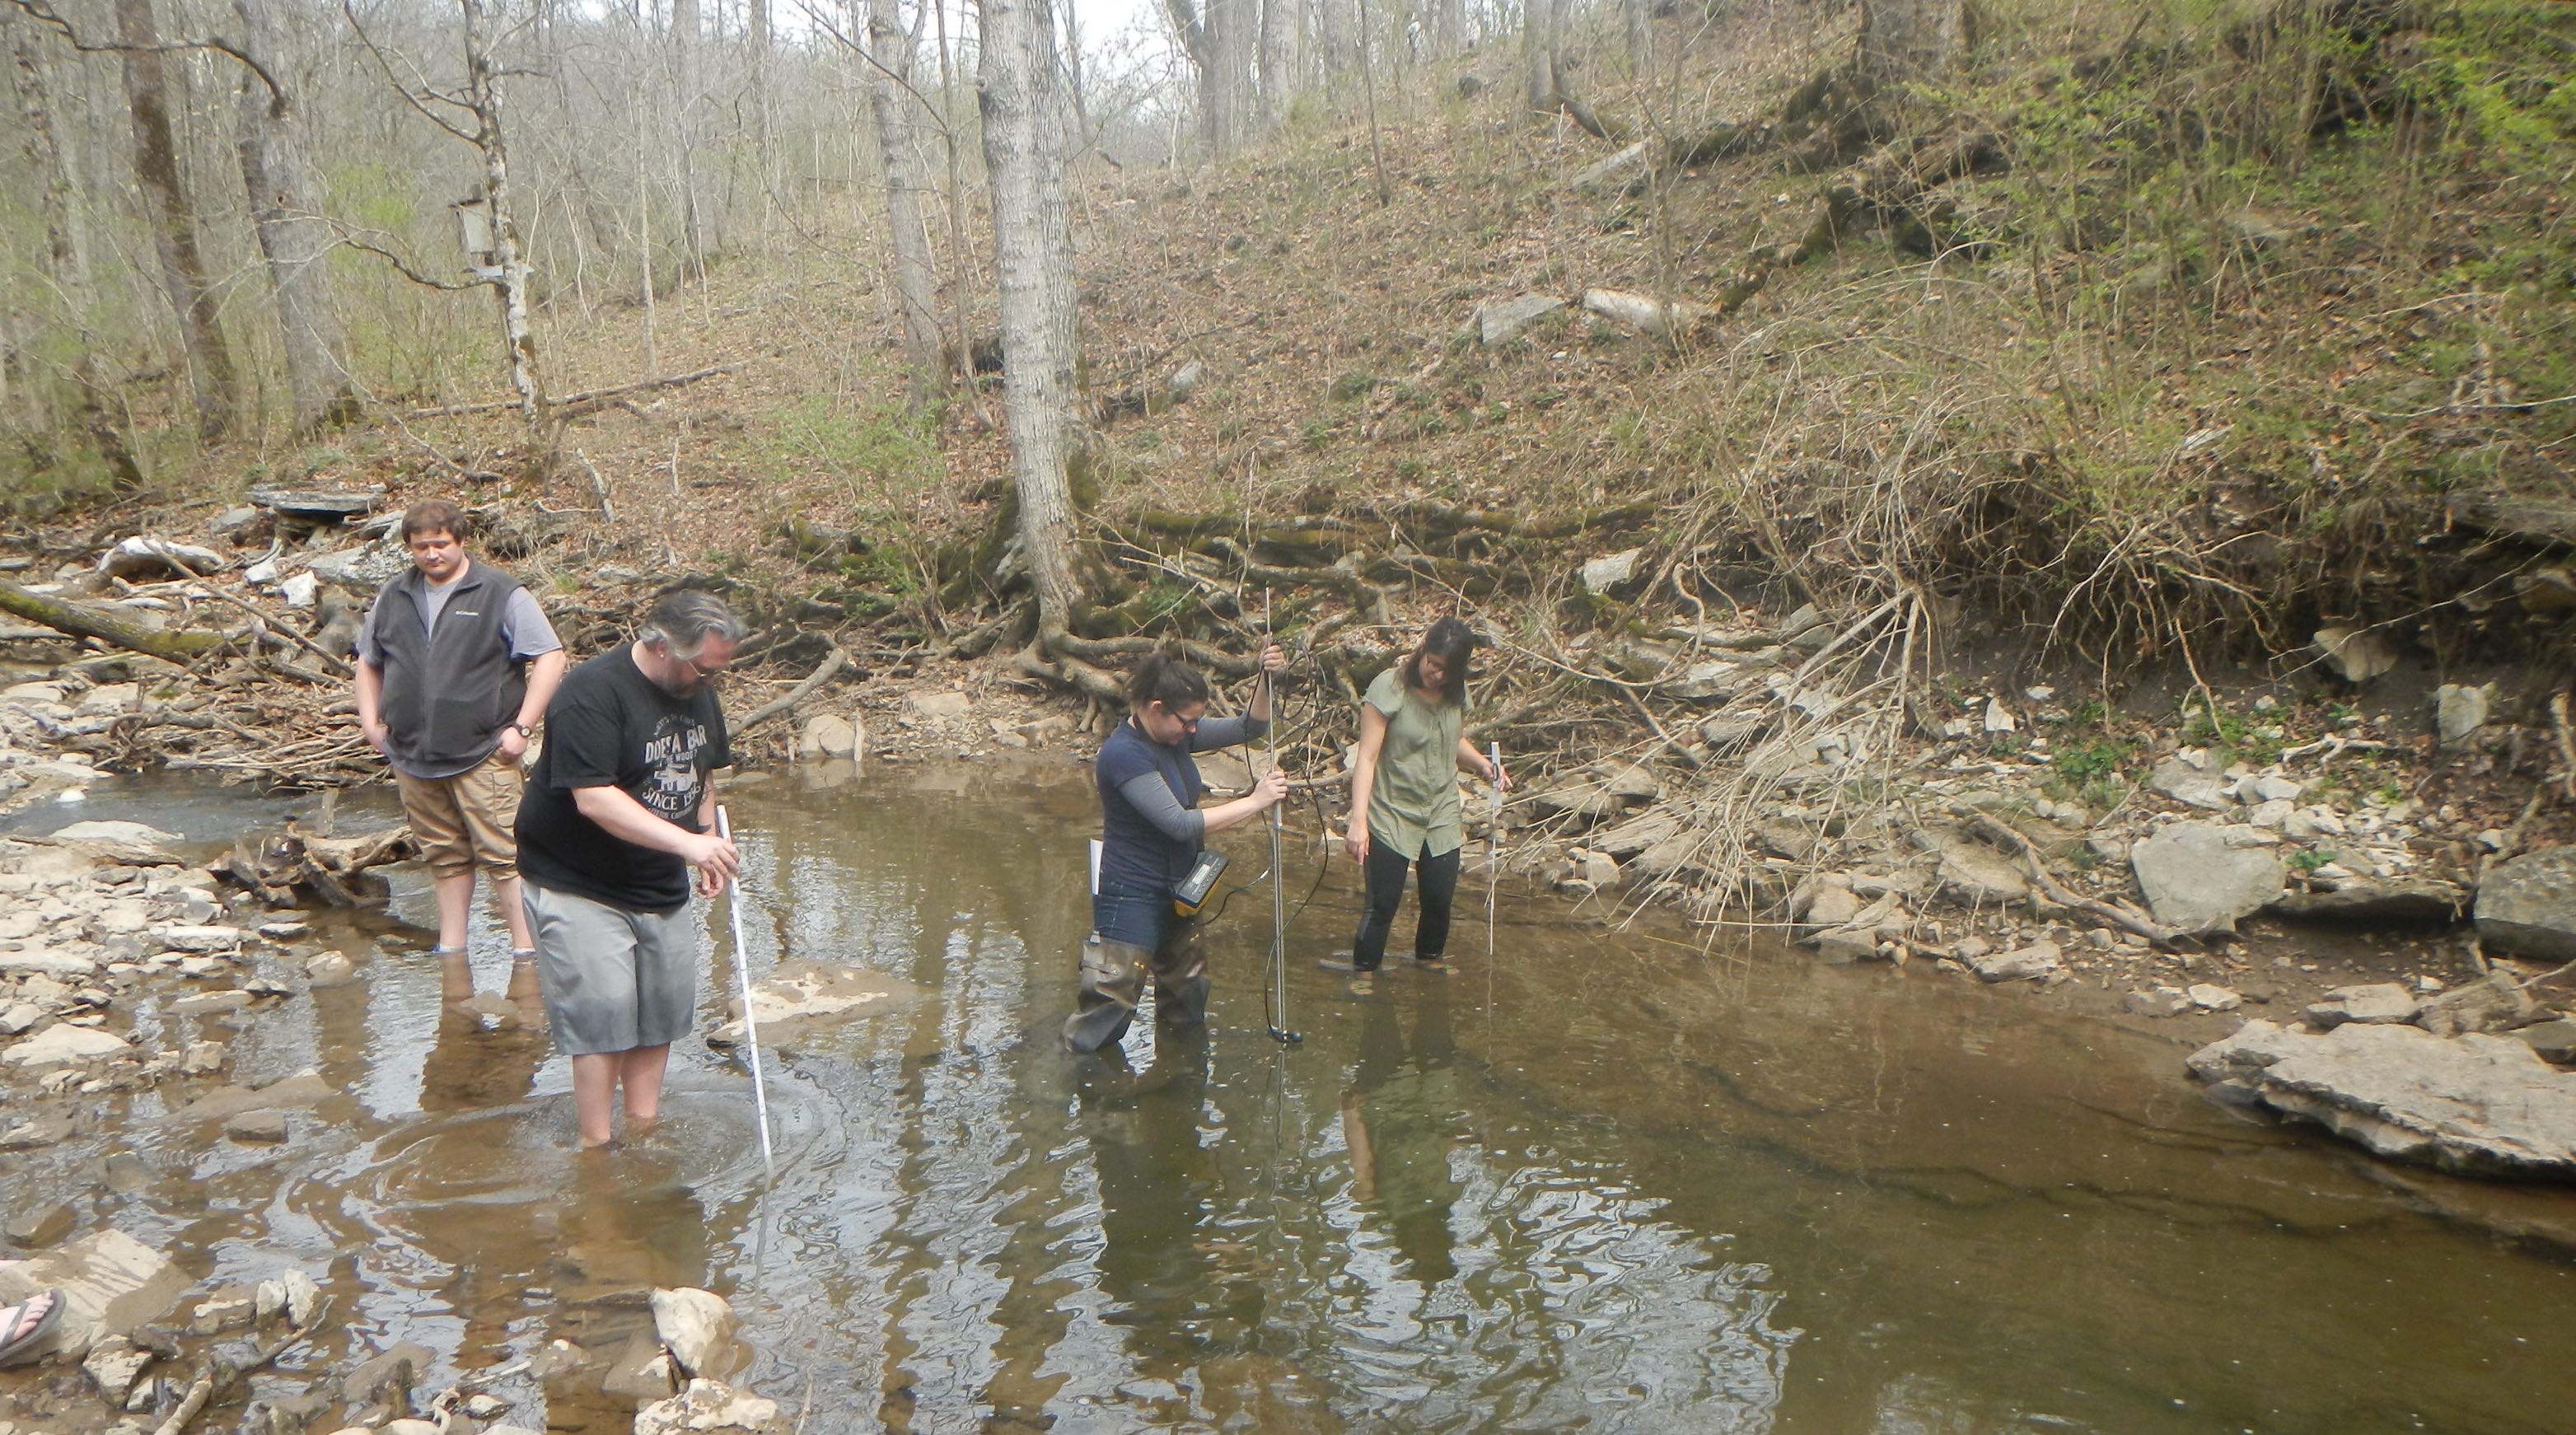
Students in my 2017 fluvial geomorphology class in Shawnee Run, Kentucky. Bank in the background is undergoing net long term erosion, but extensive local variation in bank morphology, material, roughness, resistance and vegetation is evident.
Complex, variable (in time and space) stream bank changes are inevitable, at least at the scale at which the interactions shown in the model hold. This does not preclude stability at broader scales; nor does it invalidate all-other-things-being-equal principles relating to individual relationships—for instance, other things being equal, lower bank resistance leads to more erosion. This result also indicates the need to pay attention to local variations in the key factors and proximity to thresholds, and to expect disproportionate responses and local spatial variability.
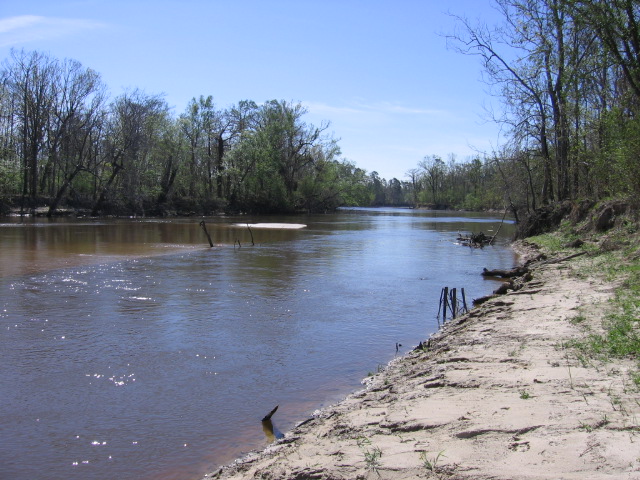
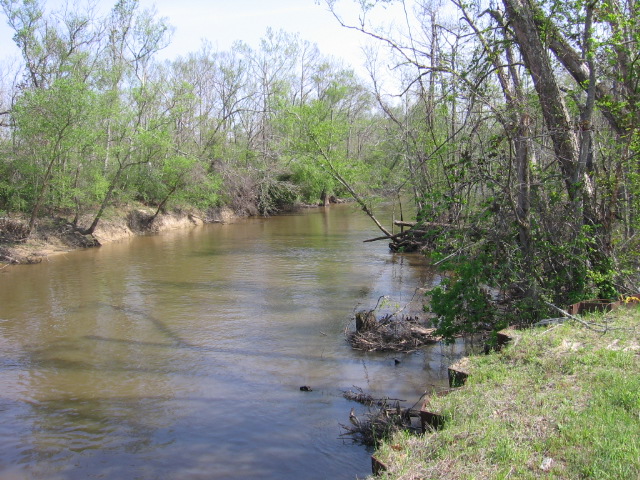
Sabine River, Texas/Louisiana, showing formerly eroding bank now at least temporarily stabilized and featuring recent deposition.
References
Questions/comments: jdp@uky.edu