
In my previous post I suggested, as have others, that we may be entering a “new normal” with respect to increasing precipitation associated with tropical cyclones. In eastern North Carolina and in south Texas we have empirical evidence in the form of Hurricanes Matthew, Harvey, and Florence in 2016-2018. Basic climatological principles suggest that the ongoing global warming will produce this result, and climate models bear this out.
The 100 largest area-averaged, multiple day precipitation events in the U.S. record from 1949-2018 were examined by Kunkel and Champion (2019). Hurricane Harvey was the single largest event for an area sized 50,000 km2 and a duration of 4 days. Rainfall associated with Hurricane Florence ranked seventh. Almost all of the top 100 events occurred in the southeastern United States or along the Pacific coast. Hurricane Matthew (2016) resulted in 1-day rainfall records at Tarboro, Fayetteville, Lumberton, and Raleigh, NC and at Florence and Dillon, SC (Weaver et al., 2016). Hurricane Florence resulted in new peak streamflow records at 28 gaging stations in the Carolinas (Feaster et al., 2018).
A key point about Matthew and Florence is that they were not particularly powerful storms in many respects when they reached the Carolinas. Matthew’s landfall on Oct. 8, 2016 at Cape Romain Wildlife Sanctuary was the first October hurricane since Hazel in 1954 to make landfall north of Florida. According to the National Hurricane Center’s (NHC) report on the storm (Stewart, 2017), baroclinic interaction associated with a mid-latitude trough caused Matthew’s cloud shield and rainfall pattern to steadily shift from the southeastern to the northwestern side of the circulation, allowing deep moisture and heavy rainfall to spread well inland over the southeastern U.S. The northwest edge of the large eyewall extended well inland and brought hurricane-force wind gusts and heavy rains to coastal regions of the Carolinas. As Matthew moved ENE to the south of eastern N.C. early on 9 October, a combination of the cyclone undergoing extratropical transition and an increasing pressure gradient from an approaching cold front caused sustained hurricane-force winds over the Outer Banks and significant sound-side storm-surge flooding.
At NC sites the minimum pressure and winds were not extraordinary. Minimum sea level pressures from Jacksonville along the coast up to Pamlico Sound ranged from 983.4 to 995.2 mb, maximum sustained winds from 26 to 41 knots, and maximum gusts from 59 to 76 knots, though Matthew’s winds were stronger further south and along the Outer Banks. Rainfall amounts were high, however. Stations near Elizabethtown in the Cape Fear River valley recorded 13.00 and 18.85 inches of rain (330 & 479 mm), and a station near Kinston (Neuse River) 16.5 inches (419 mm). Also in the Neuse River basin, two stations near Goldsboro registered 13.31 and 16.32 in (338 & 415 mm). Single-day precipitation records were set at six sites in the Carolinas as mentioned above, all with estimated recurrence intervals of >200 years, based on existing records (Weaver et al., 2016; Musser et al., 2017).
Florence made landfall as an 80-kt category 1 hurricane on 13 September, 2018 at Wrightsville Beach, N.C. The storm had weakened considerably at sea. Again, along the N.C. coast from Jacksonville to Pamlico Sound, minimum sea-level pressures (984.1 to 1003.7 mb), maximum sustained wind (35 to 49 kt), and maximum gusts (48-75 kt) were not remarkable by tropical cyclone standards (Stewart, 2018). But the rain and runoff were incredible. 33 gaging stations in the Carolinas recorded record peak flows. Precipitation totals >10 inches (254 mm) were common, and exceeded 20 in (508 mm) at N.C. rain gages at or near Emerald Isle, Jacksonville, Morehead City, Maysville, and Newport. A station in Jacksonville and one in Swansboro racked up 30.65 and 34.14 inches (779, 867 mm).
So Florence and Matthew were not particularly powerful storms in terms of maximum sustained winds, minimum central pressures, or the Saffir-Simpson scale (in many cases they had been downgraded to tropical storm status when much of the damage was done).
Why so much rain?
* * * * *
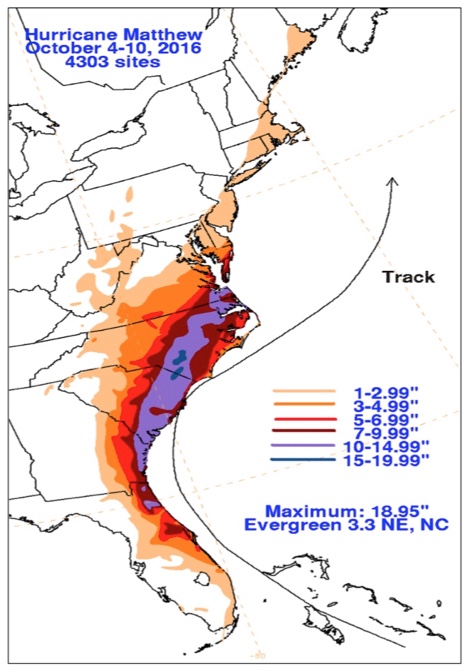
Accumulated precipitation during Hurricane Matthew, 4-10 October 2016 (D. Roth, NOAA-NWS).
In the case of Matthew, interaction of the tropical cyclone with a midlatitude pressure ridge caused the storm’s cloud and rainfall pattern to shift from the southeastern to the northwestern side of the circulation, resulting in deep moisture and heavy rainfall to spread well inland (Stewart, 2017). According to the NHC’s analysis, “the heaviest rain in eastern North Carolina resulted from a contribution of Matthew’s tropical moisture, the ongoing extratropical transition that caused the cyclone’s rains to favor the northwestern quadrant, and a pre-existing frontal boundary over the far eastern portions of the state.” Runoff and flooding from Matthew was exacerbated by wet antecedent conditions—the N.C. State Climate Office reported that monthly rainfall totals for September in the coastal plain ranged from 1.5 to more than 3 times normal.
Florence’s abundant precipitation was largely associated with its slow movement and large areal extent, which ensured that rain fell over a large area of the eastern Carolinas for a long time. Once it made landfall, the forward motion of the storm slowed to a crawl; 1 to 3 mph. Storm rainfall and gale or near gale-force winds remained over some areas for several days.
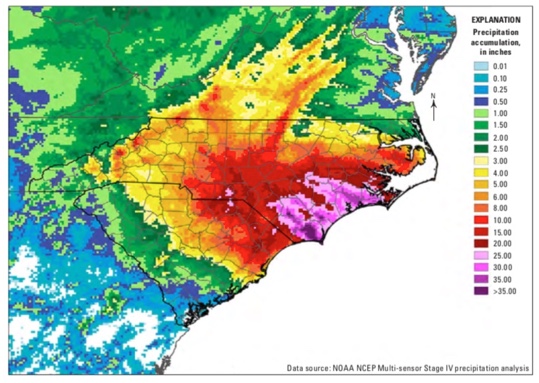
Accumulated precipitation during Hurricane Florence, 13-18 September 2018 (R. Ward, N.C. State Climate Office).
Both storms combined river flooding from inland precipitation with storm surge from the coast. Storm surges of about 2 m were experienced at Charleston and Hatteras during Matthew. Between the Carolina border and Cape Hatteras, inundation levels reached 0.6 to 1.3 m above ground level, including an historical record at the tide gauge along the Cape Fear River in Wilmington. Soundside flooding on the Outer Banks was estimated at 1.3 to 2 m (Stewart, 2017).
The Neuse River estuary was hardest hit by storm surge from Florence, even though the area never directly experienced hurricane conditions in terms of wind. Maximum storm surge inundation heights were estimated at 2.4 to 3.4 m above the ground surface (Stewart and Berg, 2019). At a site I examined in the field shortly after the storm (my back yard), wrack lines indicated water levels up to 4 m above mean high water (which would include wave effects in addition to storm surge). Inundation levels were generally 0.6 to 1.3 m above ground level along the remainder of the western shore of Pamlico Sound and southern shore of Albemarle Sound, but 0.6 m or less above ground along the sound side of the Outer Banks, according to the NHC analysis (Stewart and Berg, 2019).
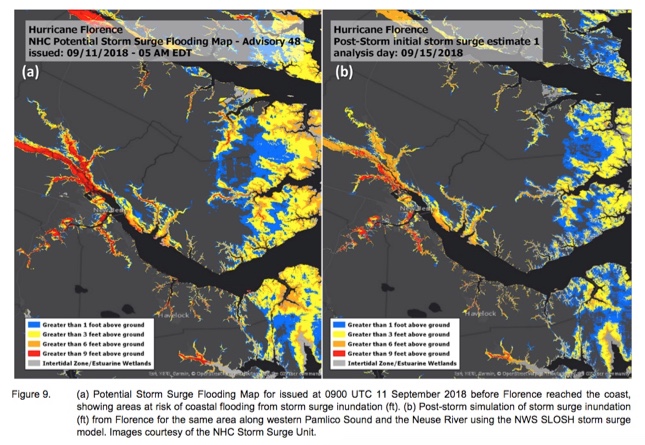
From Stewart & Berg, 2019
While this post is focused on the eastern Carolinas and Hurricanes Florence and Matthew, it is important to place these in context. Sandwiched between these storms in 2017 was Hurricane Harvey on the Gulf Coast, the largest rainfall event in U.S. history. The 2020 Atlantic hurricane season was extraordinarily busy, with the Gulf Coast and Louisiana taking the brunt.
In 2019, there was Hurricane Dorian, which did influence the Carolinas, particularly along the Outer Banks. The storm’s track and rate of forward movement (much faster than Florence!) did not produce prodigious inland rainfall in the Carolinas. However, the storm did dump 386 mm on Pawley’s Island, SC, and 580 mm on Hopetown (Bahamas) when the storm slowed to a crawl (Avila et al., 2019). Thus Dorian seems consistent with Matthew, Harvey, and Florence in delivering massive amounts of precipitation (I have not examined NHC reports from the 2020 tropical cyclones).
On the other end, in October 2015, there was major flooding in South Carolina. Strictly speaking, this was not a tropical cyclone event. An upper atmospheric low pressure system funneled tropical moisture from Hurricane Joaquin, which did not directly impact SC as a tropical system, into the state. Heavy rainfall occurred across South Carolina during October 1-5, causing major flooding in the central and coastal parts of the state. Almost 27 inches (686 mm) of rain fell near Mount Pleasant in Charleston County during this period. USGS stream gages recorded peaks of record at 17 locations, and 15 other locations had peaks that ranked in the top 5 for the period of record (some of these topped in 2016 and/or 2018). An analysis by the University of South Carolina’s Carolinas Integrated Sciences and Assessments unit characterized the event as a “fire hose of deep tropical moisture” across SC, and calculated that precipitation exceeded estimated 500-year recurrence intervals at six locations and the 1000-year event at one.
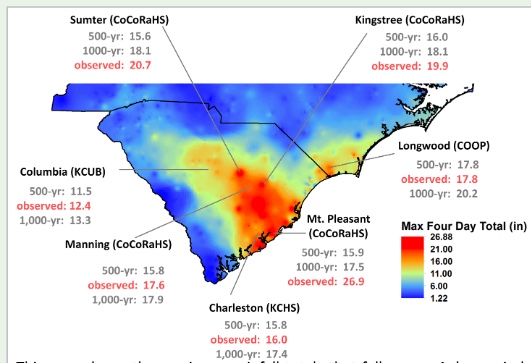
Precipitation from the October, 2015 storm (Peng Gao, University of South Carolina).
* * * * *
Climate change: No single storm, or storm season, or even three or four year trend is proof of effects of climate change. As noted earlier, however, the very low probability of the extreme hurricane rainfalls in NC is circumstantial evidence that we may have entered a new regime where such intense events are simply more common and more likely.
The climate is warming, and the south Atlantic region is no exception. Warmer air can hold more moisture. Warmer ocean water allows development, and facilitates strengthening, of tropical cyclones. Higher temperatures drive faster moisture recycling and accelerate hydrological processes.
Check out the sea surface temperatures associated with Florence, shown below. A temperature of about 26 oC (81 oF) is a threshold for tropical cyclone formation, and the warmer the better (or worse, depending on how you look at it), for storms to strengthen.
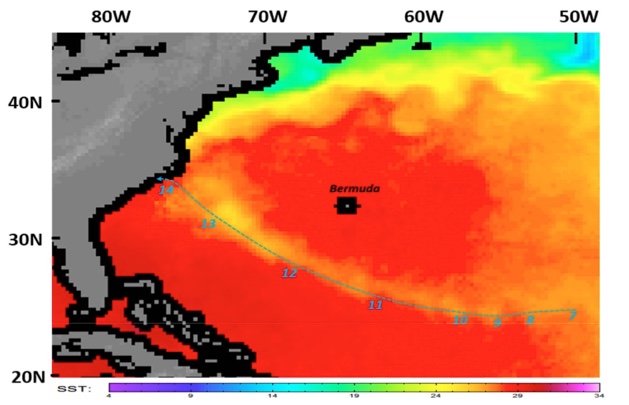
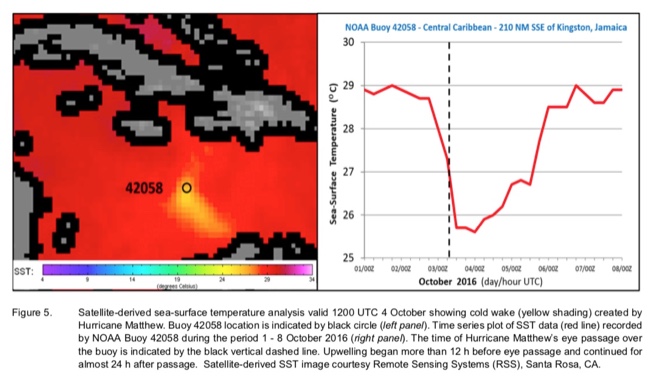
Above from Stewart & Berg, 2019. Note the slightly lower temperatures along the storm’s track. This is from relatively cooler water upwelling as the storm center passes. This is shown in detail for Hurricane Matthew, below (from Stewart, 2017).
Sea surface temperatures have been rising, globally and steadily. While the scientific jury is still out on whether this means there will be more tropical cyclones, it does mean that the average strength of such storms, and their capacity to transport and deliver moisture, is increasing. And, when the other conditions necessarily for tropical cyclogenesis are present, as in 2020, we will get a lot of them.
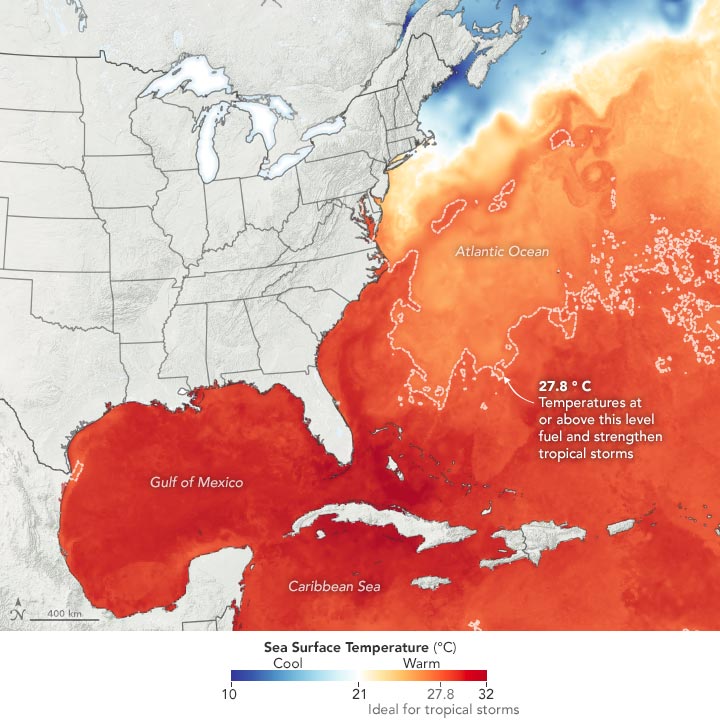
Sea surface temperatures, July 14, 2020 (https://scitechdaily.com/brace-for-an-active-2020-hurricane-season/). Based largely on such temperatures earlier in the year, an extremely active Atlantic hurricane season was forecast for this year--and that is exactly what happened.
In eastern N.C. and elsewhere, we are apparently headed for a new and wetter normal.
References
Avila, L.A., Stewart, S.R., et al. National Hurricane Center Tropical Cyclone Report. Hurricane Dorian. U.S. National Oceanic and Atmospheric Administration, National Weather Service AL0522019.
Feaster, T.D., Weaver, J.C., Gotvald, A.J., Kolb, K.R. 2018. Preliminary Peak Stage and Streamflow Data at Selected Streamgaging Stations in North Carolina and South Carolina for Flooding Following Hurricane Florence, September 2018. U.S. Geological Survey Open-File Report 2018-1172.
Kunkel, K.E. and S.M. Champion, 2019: An assessment of rainfall from Hurricanes Harvey and Florence relative to other extremely wet storms in the United States. Geophysical Research Letters, 46 (22), 13500–13506. http://dx.doi.org/10.1029/2019GL085034
Musser, J.W., Watson, K.M., Gotvald, A.J. 2017. Characterization of Peak Streamflows and Flood Inundation at Selected Areas in North Carolina Following Hurricane Matthew, October 2016. U.S. Geological Survey Open-File Report 2017-1047.
Stewart, S.R., 2017. National Hurricane Center Tropical Cyclone Report. Hurricane Matthew. U.S. National Oceanic and Atmospheric Administration, National Weather Service AL142016.
Stewart, S.R., Berg, R. 2019. National Hurricane Center Tropical Cyclone Report. Hurricane Florence. U.S. National Oceanic and Atmospheric Administration, National Weather Service AL062018, https://doi.org/10.1038/s41598-019-46928-9
Weaver, J.C., Feaster, T.D., Robbins, J.C. 2016. Preliminary Peak Stage and Streamflow Data at Selected Streamgaging Stations in North Carolina and South Carolina for Flooding Following Hurricane Matthew, October 2016. U.S. Geological Survey Open-File Report 2016-1205.
Posted 26 December 2020
Questions or comments: jdp@uky.edu