
In a spatial adjacency graph (SAG) the graph nodes or vertices are nominal or categorical spatial entities—for example soil types, landform types, geological formations, or vegetation communities. Any two nodes are connected (i.e., there exists link between them) if they are spatially contiguous. Thus, if types A and B at least sometimes occur adjacent to each other, they are connected, and if they never occur spatially adjacent to each other, there is no edge connecting A, B. In the attached note I address a spatially explicit form of SAGs, based on raster representation of categorical spatial units. In particular, it presents a method for assessing the complexity of these spatial patterns.
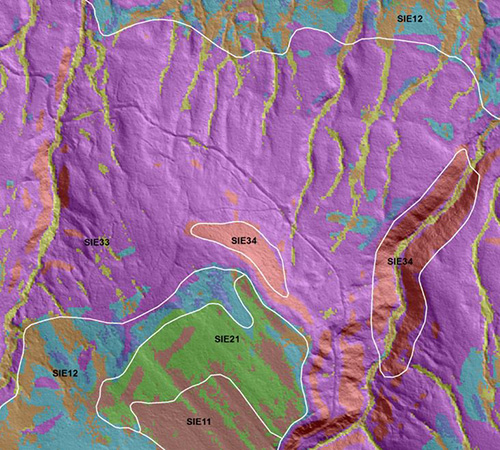
Raster soil map of Essex County, Vermont. The colors indicate the raster soil types; these are overlaid with additional data. Source: https://www.nrcs.usda.gov/wps/portal/nrcs/detail/soils/survey/geo/?cid=stelprdb1254424
This method may be useful for remote sensing and GIS-based analyses of large data sets. If this seems to be coming out of nowhere, please see this previous post for explanation.
--13 November 2020