
Tobias Heckmann, Wolfgang Schwanghart and I recently published the second of our two articles on applications of graph theory in physical geography & geosciences: Graph Theory—Recent Developments of Its Applications in Geomorphology (Geomorphology, v. 243, p. 130-146). The other paper, an overview of graph theory in geosciences, was promoted in this post.
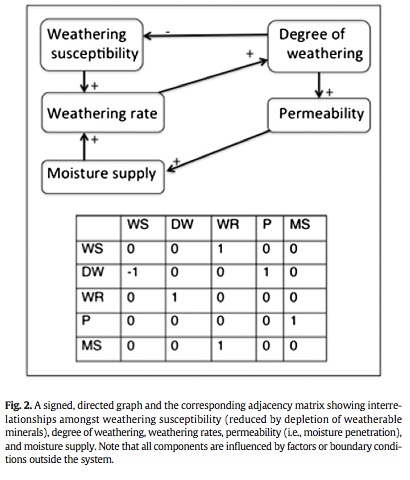
Example of a structural graph, from the article.
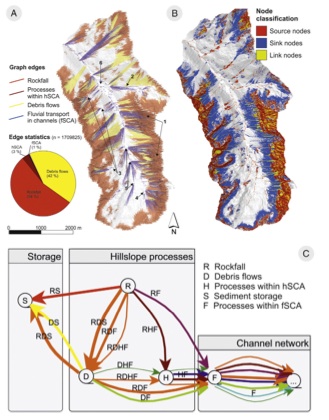
Example of a spatitally-explicit graph (Fig. 6 from the article. The caption: (A) Spatial graph of sediment pathways in the Zwieselbach catchment, Austrian Central Alps. Nodes represent raster cells of a DEM with 5 m resolution. Edges (coloured by geo- morphic process; hSCA and fSCA refer to slope wash and fluvial processes, respectively) were created using numerical models. (B) Node classification highlighting the role of the respective node as sediment source, sink, or link within sediment cascades. (C) Summary of types of sediment cascades starting from sediment sources. The letters denote the sequence of geomor- phic processes within the respective cascades, arrow thickness represents the number of the corresponding cascades. All figures are taken from Heckmann and Schwanghart (2013).