
Blogs

The Stories We Could Tell 2

Each account of landscape evolution, development, or history--whether narrative, chronology, model, or otherwise--is considered a story. Each story implies a beginning (starting point, initial condition, genesis), a middle, and an end. The middle includes the processes, transformations, or pathways connecting the beginning to the end. The end may be a final state, culmination, or conclusion per se, or the contemporary or observed state at a given point in time.

The evolutionary path (EP) described by each story is presumed to exist, and thus has one beginning, one middle, and one end. A complete story includes an account of all three. However, many scientific stories are incomplete, and may include only two of the three elements, with the third conjectured or inferred. For example, an initial condition and end state may be known, but the processes or transitions between them unknown. Or the processes or changes may be known, but either the initial state or end point unknown. Thus, while a complete story has one each of beginning, middle and end, an incomplete story may have >1 potential, unknown, or conjectured beginnings, middles, or ends.

Circular landform features, each of which is a complete story, with a single known beginning (cause), middle (formation and development process), and end (observed form). Clockwise from upper left: Crop patterns due to center-pivot irrigation, karst doline, soil and understory vegetation patterns associated with tree canopy shading and dripline; eye of a hurricane; weathering pits on rock surface; lunar craters.


Each EP may have >1 associated stories. This may be due to different perceptions, motivations, etc. (Rashomon effect), or due to multiple occurrences of certain EPs. Where N multiple stories exist, nb, nm, neare the total number of recorded or purported beginnings, middles and ends.

If all stories are complete,

 nb, nm, ne < N

If stories are incomplete, nb, nm, ne could be > N.

Evolution of Icicle Bend, Shawnee Run, Kentucky from Jerin and Phillips, 2017. This is an incomplete story. The observed condition (D) and the reconstructed initial condition (A) are known, so nb, ne = 1. However, nm > 1, as B and C are inferred and the details are uncertain.


Where nb, nm, or ne, are all equal to N, stories are unique. Where nb, nm, ne < N, and especially where n << N (indicating that occurrences in multiple stories is not coincidental), there exists repetition.

nb, nm > ne  indicates convergence

 nb, nm > ne = 1 indicates equifinality

 nb < nm, ne indicates divergence


Examples of badland erosional topography, illustratring equifinality. If “badland” is considered the end of the story (ne = 1), the different starting points and erosion histories indicate nb, nm > 1.


This is how I sought to map the idea of storytelling to some of the key themes in my forthcoming landscape evolution book, but wasn’t quite able to fit them in.

_______________________________________________________________

Jerin, T., Phillips, J.D., 2017. Local efficiency in fluvial systems: Lessons from Icicle Bend. Geomorphology 282: 119-130.


 Posted 3 December 2020

Send comments or questions to jdp@uky.edu

The Stories We Could Tell

History, wrote Tony Horwitz (2008), is an arbitrary collection of facts and observations. Myths are created and perpetuated. To expand a bit in the context of historical Earth and environmental sciences, history is an arbitrary collection of facts and observations, filtered by aspects of historical preservation, and limitations of perception and interpretation. Historical narratives are created, negotiated, and perpetuated. Historical narratives—explanations, chronologies, historical descriptions, chronicles, and, yes, myths—are forms of stories. The key point is that while historical science is (at least at its best) grounded in facts and data, however censored and variably perceived, the reporting and dissemination thereof is in the form of created, negotiated, and perpetuated stories.

The vast majority of historical narratives in Earth and environmental sciences and interpretations of observed temporal patterns, I argue here, can be characterized in terms of nine basic storylines:

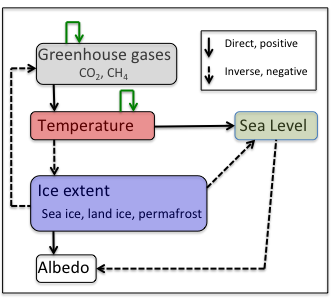
1. Steady-state equilibrium. These are balance-of-nature narratives, indicating that landscapes proceed toward some state of stability or balance. Equilibrium theory in geosciences, pedology, and ecology underpins this storyline.

2. Progression to climax. These plots are often, but not always, tied to equilibrium notions in that the climax states are often assumed to be stable steady states. This storyline is based on progression toward some predetermined end-point state, though the possibility of disruption or disturbance is often part of the story. Classical succession theory in ecology, progressive development toward mature zonal soils in pedology, and the Davisian cycle of erosion in geomorphology are examples of this storyline.           

3. Progress, progressive development, improvement. Biological evolution and landscape development are portrayed as involving a general improvement over time—e.g., organisms become better adapted, ecosystems optimize mass and energy fluxes, flow networks increase in efficiency, etc. These storylines can be consistent with equilibrium, climax, and preordained path (see below) plots, but also with stories based on selection.           

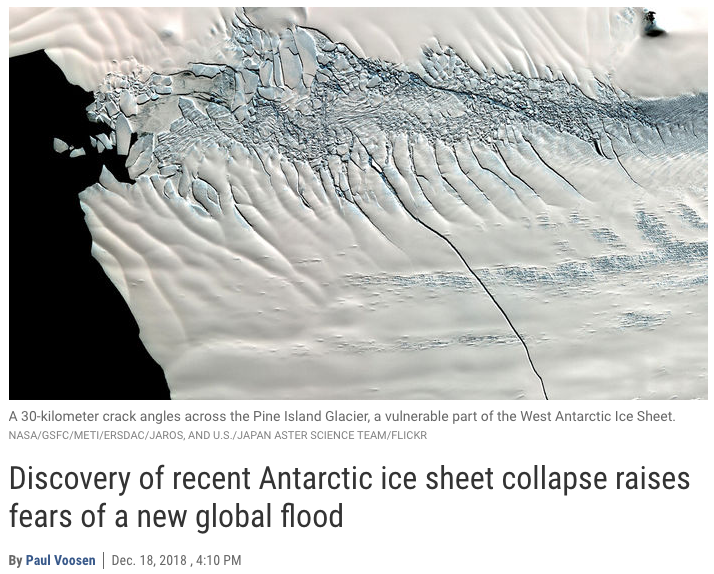
4. Inevitable, preordained path to present. These narratives occur in at least two different varieties. In some, particularly pre-late-20th century science and natural history, the present is implicitly or explicitly viewed as the preordained conclusion of historical development. Historical narratives are thus geared toward explaining how the current situation came to be. The second variety does not view the present as preordained in any teleological or normative sense, but rather is based on the idea that given the sequence of events on the planet, the present condition was the only possible outcome.


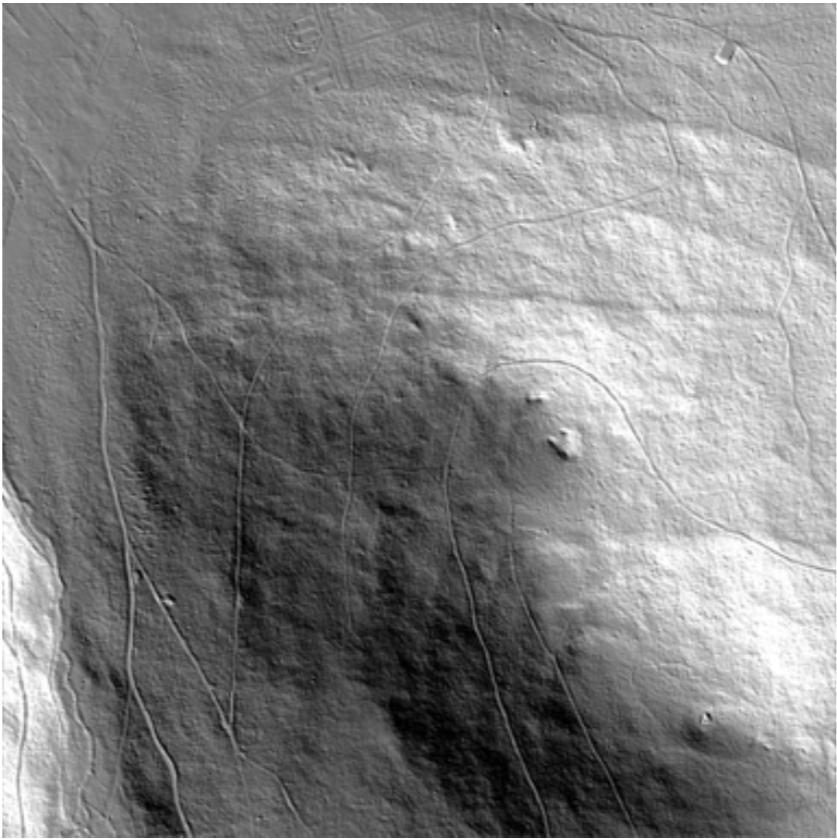
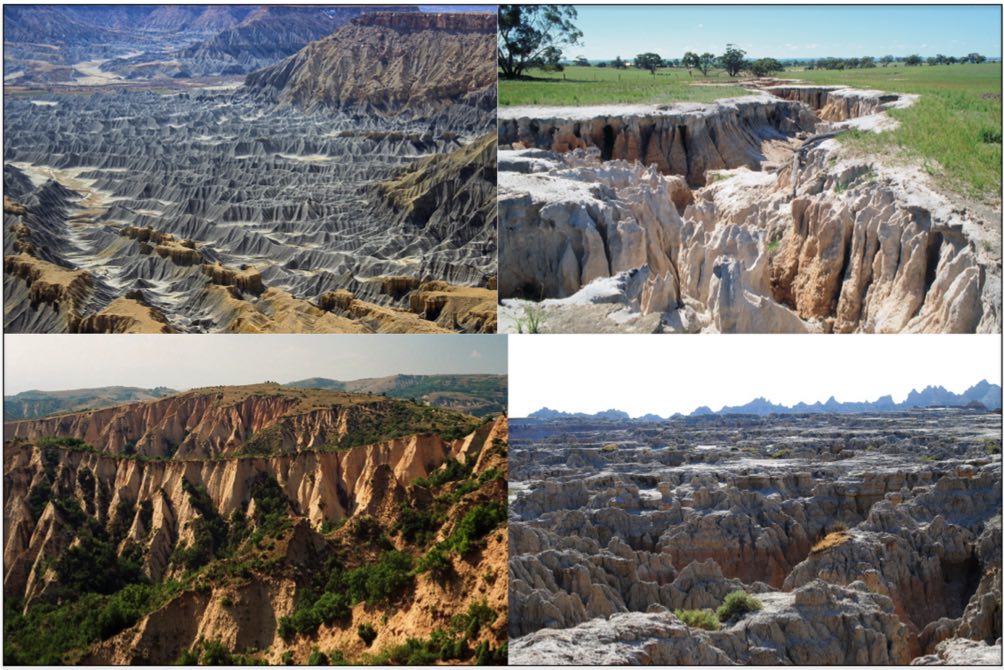
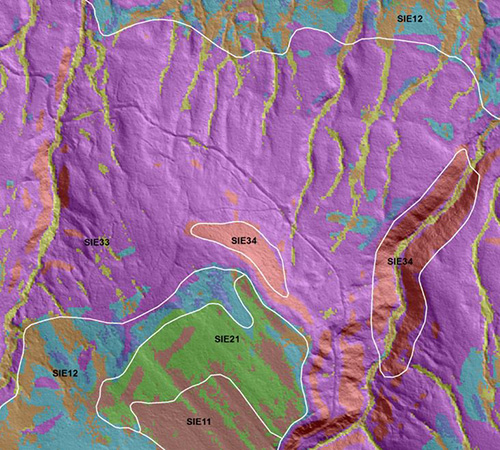
Detailed relief map of a section of the Sumava Mountains (near Polednik), Czech Republic, based on high resolution LiDAR data (courtesy of Sumava National Park, CZ). Note the lack of fluvial dissection. I am currently involved in research seeking to explain how/why, in this moist climate, few channels have formed at the higher elevations and on the mountain slopes. While this may be eventually interpreted in terms of other storylines, at the moment it is a "how did the current condition come to be" story.


5. Chaos, chance, and nonequilibrium. This type of storyline often emphasizes the role of chaotic dynamics and dynamical instabilities in opening up multiple possibilities for both evolutionary pathways and potential outcomes. However, these plots are not necessarily linked to complex nonlinear dynamics; they may simply recognize the role of chance, randomness, and path dependence.

6. State change storylines narrate historical development as a series of changes in landscape conditions or states. They are consistent with, but often not explicitly linked to, state-and-transition models and concepts. While single-path, single-outcome trajectories can be accommodated by state-and-transition frameworks, these narratives are generally used to emphasize multiple-path, multiple-outcome histories, potential reversibility of development, and contingency.

7. Selection. Historical narratives with selection plots recognize the possibility of multiple pathways and potential roles for chance but emphasize one or more overriding selection principles that constrain evolution. Generally, these are based on probabilistic rather than deterministic notions—that is, the selected-for attributes are more likely, but not inevitable or predetermined. 

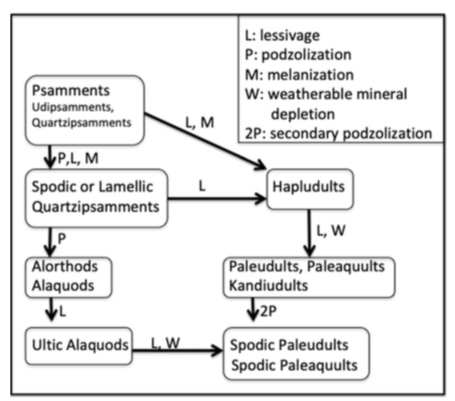
Figure 7 from Phillips (2019) on evolutionary pathways in soil development, based on studies of the North Carolina coastal plain. This story has elements of the chaos/nonequilibrium, state change, and selection storylines (see source article).


8. Self-organization storylines explain landscape evolution in terms of a tendency toward some form of autoregulation, via autocatalysis rather than (or at least independently of) external forcings and boundary conditions. Self-organization plots may be consistent with other storylines, especially equilibrium and selection. They may involve goal functions, whereby landscapes are said to maximize, minimize, or optimize some factor (in which case there is overlap with progressive development/improvement storylines). Self-organization plots may also be based on a predetermined state, such as in theories of self-organized criticality.


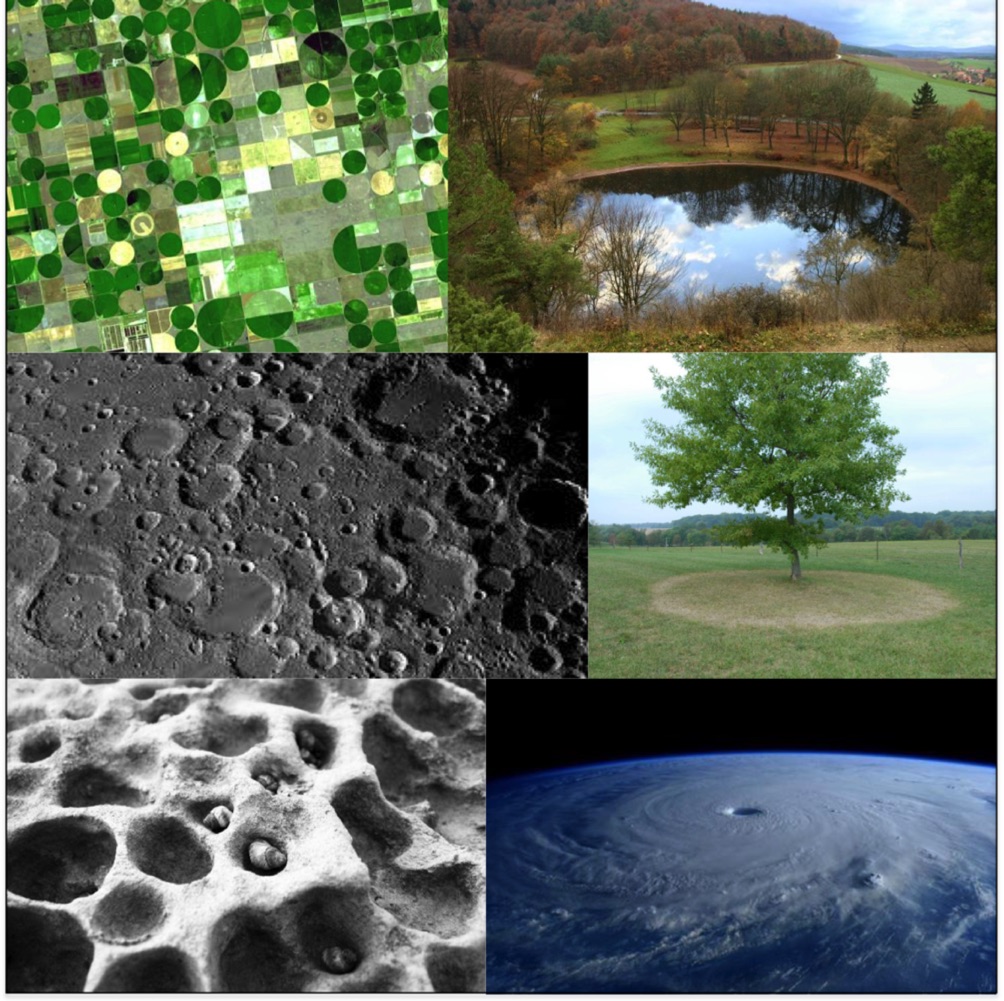
9. Unsolved mystery. Some storylines identify phenomena that either cannot be explained by existing hypotheses or theories, or for which evidence is insufficient to apply one of the other storylines. These narratives typically emphasize landscapes that are considered anomalous or oddities in some way, or for which there are multiple competing explanations with no consensus. Classic examples include the origins of the Carolina Bays of the southeastern U.S.A. (Zamora, 2017), the “sliding rocks” of racetrack playa in Death Valley, U.S.A. (Hooke and Jones, 2015), the “fairy circles” of Namibia (Tschinkel, 2015), and the origin of life on Earth.

These storylines relate directly or indirectly to the outcomes of landscape evolution, and are thus related to the idea of attractors, goal functions, and other purported end-points or governing factors. That will be the subject of the next post.

---------------------------------------------

Hooke, R.LeB., Jones, R. 2015. Racetrack Playa: Rocks moved by wind alone. Aeolian Research 19A, 1-3.

Horwitz, T. 2008. A Voyage Long and Strange: Rediscovering the New World. New York: Henry Holt.

Phillips, J.D., 2019. Evolutionary pathways in soil-geomorphic systems. Soil Science 184: 1-12 (attached).

Tschinkel, W. 2015. Experiments testing the causes of Namibian Fairy Circles. PLoS One 10(10): e0140099. doi: 10.1371/journal.pone.0140099

Zamora, A. 2017. A model for the geomorphology of the Carolina Bays. Geomorphology282, 209–216. https://doi.org/10.1016/j.geomorph.2017.01.019

Posted 2 December 2020

Comments or questions? Contact me at jdp@uky.edu.


Attachments:
Soil EPs.pdf (903.82 KB)

Climate Change and Stars to Steer By

Earth’s climate is changing. Always has, always will; so that statement would’ve been true a thousand years ago, and will be so a thousand years hence. However, evidence is accumulating that climate is now changing faster and more radically than ever before in human history, faster than ever before in the recent geologic past, and in some respects faster than in Earth history, period. 

Villagers cluster on Polder 32, an artificial island in southwest Bangladesh with an uncertain future (Tanmoy Bhaduri, Sciencemag.org)

In addition to sea-level rise, global warming puts Bangladesh at greater risk for stronger and more frequence tropical cyclones.

Whether one views humans as stewards, masters, or neutral actors in nature, we are accustomed and adapted—ecologically, economically, socially, and culturally—to environmental conditions which have characterized the periods in which our ecosystems, economies, societies, and cultures have developed. Changes in those environmental conditions—which are recursive in the sense that humans change the environment while environment constrains and influences humans—thus have implications well beyond the realm of climate and environmental science. 

Naturally, we want clear answers about the impacts of climate change. We want unambiguous forecasts, accurate predictions, and clear indications on what to do. 

Alas, we will not get them. 

We will often be wrong, and even the right answers will be often incomplete. 

Sea surface temperatures, mid-September 2020 (from Windy.com). The entire area shown has temperatures high enough to facilitate the development and strengthening of tropical cyclones, which is exactly what happened. 

Certain to be uncertain

Climate change will have profound impacts on plants, animals, ecosystems, rivers, lakes, glaciers, ground water supplies, and biogeochemical cycles. Climate change will have significant effects on soil erosion, landslides, avalanches, wetlands, rock weathering, and coastal erosion. Climate change will severely influence agriculture, forestry, energy, transportation, and trade. The problem is that while the occurrence of such impacts is a virtual certainty, their specific nature and manifestation, timing, geography, and severity is also certain to be highly variable—and highly uncertain. Even more, the interactions between and knock-on effects of climate change impacts are highly uncertain, sometimes offsetting or cancelling each other out, sometimes exacerbating or reinforcing each other, sometimes sending earth surface systems into entirely unexpected directions. 

Mountain pine beetle larvae at work. Climate warming has allowed a major range expansion of these wood-eaters in North America, as well as the spruce bark beetle in Europe and other bark beetles (source: animalspot.net). 

The fact is—and I would say the same whether you are a complete amateur in the field or a world-class geoscientist—that you don’t know exactly what is going to happen, and neither do I. But complexity, no matter how severe—does not mean intractability. Some of the principles of complexity, nonlinear dynamics, and contingency that I have (and continue to) emphasize over the years have been interpreted as implying that (some) Earth surface systems are unpredictable. This is not so. What these principles indicate is not unpredictability, but a new context for prediction. 

Yedoma is a type of permafrost that is rich in carbon, releasing large quantities of greenhouse gases if it thaws. This yedoma exposure is on the Lower Koluma River in Northern Yakutia, Russia. (Credit: Nicolay Shiklomanov/National Snow and Ice Data Center)

I have often stressed uncertainties and multiple possibilities, but be clear:  Uncertainty is no excuse for inaction. When the house is afire, you may be unable to estimate the rate of heat release, the flammability and consumption rate of various materials in the house (which will also vary with their age and ambient environment), the probabilities of fire propagation in various directions, or the fluid dynamics of air flow in the vicinity, which will of course change as the fire proceeds. You do know, however, how to put the fire out, and that you damn well better call the fire department or grab a hose or bucket or extinguisher. You also know that it would be idiotic and disastrous to calculate or debate the cheapest possible way to contain the fire, and the minimum amount of water required to quench it. The house is on fire, and it is past time to grab a bucket. 

California wildfire (source: WTOP.com)

Understanding, assessing, and predicting impacts of climate change is not at all like programming a computer, where a specific set of instructions produces a specific output (though even in this case deterministic chaos is possible!).*  It is much more like sailing a boat, where a good sailor will make frequent adjustments to the wind and waters, based partly on ironclad universally applicable scientific principles, partly on general principles and practices, and partly on instinct and intuition based on training and experience. 

The broader question, of course, is what we want to program the computer to do, or where we want to sail the boat. Unfortunately, we cannot now—and may never be able to—plot a precise course (or produce a specific algorithm). We can, however, identify some signposts and landmarks and rules of thumb for pathfinding—some stars to steer by. The kind of research I advocate and practice is not intended to make specific predictions or forecasts, but to identify some alternative paths. Not to devise global laws, but to present general lessons. 

------------------------------------------------------------------

*This analogy is not intended to criticize the use of computer models in climate change impact research!


18 November 2020

Mode Shifts in Weathering Profile Evolution

Geomorphic and pedologic systems and ecosystems may sometimes experience mode shifts from dynamically unstable, divergent development to dynamically stable and convergent (or vice versa)(Phillips, 2014).  Here I explore the idea of how this can occur in the evolution of soil, regolith, and weathering profiles. 

Weathering profile, NSW, Australia


In a 2018 article, I analyzed the model below, based on epikarst soils.

From Phillips, 2018. 


The sytem is dynamically unstable by the Routh-Hurwitz criteria. However, the system becomes dynamically stable if the dotted-line links shown are ignored. These links are present if subsurface accommodation space and moisture supply are limiting for biota, and weathering is moisture (rather than reaction) limited, and the self-limits shown in the figure are approached. Dynamical instability implies unstable self-reinforcing growth or acceleration of weathering, joint size, moisture flux, and biological activity. However, when these links are absent – i.e. when root growth or biotic activity is not limited by accommodation space or moisture, and weathering is reaction limited – the system is dynamically stable. 

Epikarst, central Kentucky.


Below is a similar system model for non-karst systems. One key difference is a direct positive link between weathering and moisture flux. In karst, moisture flow is dominated by joints, etc., but weathering of non-carbonate rocks often has important influences in increasing porosity and permeability. Another is the self-limiting effect of depletion of weatherable mineral in many rocks, which does not occur in limestone and other karst rocks. In either case water flux may have positive or negative effects on soil development. For the non-karst case, however, the negative link from soil development to moisture flux is absent. In both cases it is assumed that soil development (mainly thickness) exerts a negative influence on bedrock weathering due to increasing buffering of the weathering front from precipitation and surface biological activity (this is not always the case, but changing the link to positive does not change the outcome of the stability analysis). 

Like the epikarst system, the non-karst system is dynamically unstable. Also like the epikarst version, the non-karst system is stable if the dotted-line links are removed. 

In both cases (epikarst and non-karst) the stability analysis suggests a mode shift for situations where weathering profiles are developing in weathered bedrock. In early stages, regolith is thin or absent, soils are minimally developed, and there is limited below-ground space for roots (and soil fauna).  Due to the limited soil cover, moisture is likely to be a limiting factor for biota. Because bedrock is still relatively intact (joints, etc. have not been widened much; porosity is limited), moisture availability is a limiting factor for weathering. Inherent limitations on organisms (factors other than water and space, and metabolic limits) and moisture (climate) have not been approached, at least as related to the weathering zone.  Changes—both due to disturbances and ongoing development—tend to be self-reinforcing. Variability—for example, depth to bedrock or the degree of weathering—generally increases. Weathering begets more weathering; biological activity begets more biological activity; and moisture flux begets more water flow, through the network of system interactions. 

Young weathering profile in sandstone, Arkansas. The rock was exposed by construction 25 years before the photograph was taken. 

Later on, however, soils are thicker and more fully developed. Joints and conduits are widened; moisture flows freely. Belowground space and moisture may no longer be limiting factors.  Weathering may become limited by weatherable minerals or geochemical kinetics, not moisture; and biota by factors external to the soil and regolith. Moisture may be limited by climatic inputs and/or landscape scale flow patterns. Then the system may become dynamically stable and convergent. Differences in the degree of weathering or the thickness of the profile begin to shrink. Trees and organisms, now firmly rooted in soil, have less effect on weathering.  A divergent to convergent, unstable to stable mode shift has occurred. 

Thick, maturely developed profile in sandstone, NSW, Australia.

The shift is not irreversible. Erosion and denudation can, for example, strip most or all of the soil cover; a lava flow can create a new surface for weathering to begin anew; or glacial ice can bury it, to exhume it again when the ice retreats.  

Between clock-resetting events that flip the mode back to divergent, unstable evolution, however, a potential general trend suggests itself, as shown below. During the divergent phase, variability increases up to some maximum, and then declines. I hypothesize that the increase in variability would be steeper due to the net positive feedbacks, and the decrease less steep due to the fact that the mode shift is triggered by the approach to limits in some system components.


But how to test this hypothesis? I have no doubt that I could develop a realistic, plausible model that reproduces the trends shown in the figure above. I also have no doubt that many others could do the same, likely better and more easily than I. But I am equally sure that any of us could also produce a realistic, plausible model that does not support the hypothesis.

The hypothesis could be confirmed by finding chronosequences long enough to reflect the mode switch and which preserve measurable variability in the phenomena of interest. But falsifying it would be more difficult. If results fail to support the proposed trend, is it because the chronosequence is too short, or does not reflect the mode switch point? Is it due to the well known but unavoidable shortcomings of chronosequences, such as the inability to hold all other factors except time or age constant, and the fact that surfaces or parent materials of different ages will have experienced different histories? 

A caveat to this analysis is that it applies to weathering profiles formed mostly, if not entirely, in in situ bedrock. In Phillips (2010), I analyzed the Soil Atlas of Europe (European Soil Bureau Network, 2005), at the time the only comprehensive, detailed, continental scale soil map(s) and inventory. Of the 23 major soil types identified in the atlas, only six are likely to be residual soils derived from bedrock weathering, and three are formed in unconsolidated parent materials such as glacial till or alluvium. Of the remainder, some may be residual or not, and some are unlikely to be. Mature development is a distinct possibility in 11 of the soils, while six are immature by definition. Among the others, mature development is either uncertain or unlikely. Overall, Phillips (2010) estimated that 75% of the European land area consists of taxa where maturely developed residual soils derived from bedrock are unlikely. Intuitively, I suspect this proportion would be smaller on other continents, especially Gondwanan remnants. However, it does show that this analysis—like others based on residual soils formed in weathered bedrock—is not applicable to many of Earth’s regoliths or weathering profiles.

Limestone weathering profile, central Bohemia, Czech Republic

---------------------------

References

European Soil Bureau Network, 2005. Soil Atlas of Europe. European Commission, Brussels.

Phillips, J.D. 2010. The convenient fiction of steady-state soil thickness. Geoderma 156: 389-398. 

Phillips, J.D., 2014. Thresholds, mode-switching and emergent equilibrium in geomorphic systems. Earth Surface Processes and Landforms 39: 71-79. DOI: 10.1002/esp.3492

Phillips, J.D., 2018. Self-limited biogeomorphic ecosystem engineering in epikarst soils. Physical Geography 39: 304-328. 


--17 November 2020

Complexity of Raster Spatial Adjacency Graphs

In a spatial adjacency graph (SAG) the graph nodes or vertices are nominal or categorical spatial entities—for example soil types, landform types, geological formations, or vegetation communities. Any two nodes are connected (i.e., there exists link between them) if they are spatially contiguous. Thus, if  types A and B at least sometimes occur adjacent to each other, they are connected, and if they never occur spatially adjacent to each other, there is no edge connecting A, B. In the attached note I address a spatially explicit form of SAGs, based on raster representation of categorical spatial units. In particular, it presents a method for assessing the complexity of these spatial patterns. 

Raster soil map of Essex County, Vermont. The colors indicate the raster soil types; these are overlaid with additional data. Source: https://www.nrcs.usda.gov/wps/portal/nrcs/detail/soils/survey/geo/?cid=stelprdb1254424

This method may be useful for remote sensing and GIS-based analyses of large data sets. If this seems to be coming out of nowhere, please see this previous post for explanation. 

--13 November 2020

Attachments:

LANDSCAPE EVOLUTION

It has been 21 months since I posted to this blog. Partly that can be attributed to laziness; partly to not having anything new to say (at least about Earth and environmental sciences and geography) that I did not have another outlet for. I'm not sure anyone really noticed the blog was gone, but now it is back. 

Much of that no-blog time was spent writing a book, to be published by Elsevier, on landscape evolution. This will integrate geomorphological, pedological, ecological, and hydrological theories on the evolution of landscapes, ecosystems, and other Earth surface systems. It is grounded in an approach based on the inseparability of landform, soil, and ecosystem development, vs. the traditional semi-independent treatment of geomorphic, ecological, pedological, and hydrological phenomena. Key themes are the coevolution of biotic and abiotic components of the environment; selection whereby more efficient and/or durable structures, forms, & patterns are preferentially formed and preserved; and the interconnected role of laws, place factors, and history. 

It will be awhile before it actually get published--I have finished a first draft, and there will be revisions and corrections and all that other stuff that has to be done before a book can be published. 

But in the process, I have discovered new things to say. Some I had thought to put in the book, but as it turns out they just didn't fit. Others came to mind as offshoots or diversions as I wrote the book. Some of them, no doubt, deserve obscurity and will get it. Others are potentially useful and interesting, but not quite fleshed out enough to justify an article (and besides, my retirement looms, and my reward for publishing articles will be even less than it is now). So I will use this blog to share these ideas in hopes that someone may find them helpful--or even follow up on them!

More to come . . . really. 

NO NORMAL

As climate change and its many impacts unfold, many worse than we had forecasted or feared, many observers have indicated that Earth is entering a “new normal.” This is not wrong. However, with respect to our ability to understand, adapt to, and predict environmental change from here on out, it is probably more accurate to say there is no normal. The climate and environment that we will contend with will be unlike any our species—much less our infrastructures, institutions, and cultures—has ever encountered. I agree with those who say, sometimes circumspectly and sometimes directly, that it is time to panic. Not in the sense of panic as uncontrollable fear or anxiety that can cause wildly unthinking behavior, but in the sense of another definition: a frenzied hurry to do something. Scientists hate to be called alarmist, but when the house is on fire, you sound the alarm.

New York Times, February, 2019


Do something involves taking whatever measures we can, as vigorously and as soon as we can, to cut anthropic carbon emissions and limit the damage. Do something involves recognizing that a change is underway, like it or not. To ask whether one believes in climate change is like asking whether they believe in cells or earthquakes—climate change, cells and earthquakes exist, whether you or I believe them or not. Do something involves figuring out how to adapt to change and mitigate its adverse impacts.

There are more thoughtful and knowledgeable folks to elaborate on the points above. I’ve been trying to think about how geoscientists and environmental scientists can best do something in our professional lives. For those directly involved in climate science this is probably evident. For the rest of us, even those who have not been involved in studying climate change impacts have to come to grips that climate change is influencing, or soon will, everything we study—landforms, soils, ecosystems, water resources, and on and on. That doesn’t necessarily mean that every geomorphologist, hydrologist, or ecologist should make climate impacts the focus of their work. It does mean that we should think about how what we know, think we know, and learn can inform our understanding of and adaptations to climate change and its impacts.

Because Everything is Connected to Everything Else (the first law of geography) and All Other Things are Never Equal (2nd law of geography) we will have to confront more complexity. The first and second laws have always applied, but global climate shifts change everything, at more or less the same time. Experience will be less helpful as we move into unchartered territory.

Johann Wolfgang von Goethe (1749-1832) had it right.


I need to think more about this. We all need to think more about this. But I do have two recommendations to start with.

From precedents to analogs

Much can be, has been, and will be learned from studying the closest precedents we can find in Earth history to the current and near-future situation—periods of higher or rising temperatures, greater carbon dioxide emissions, rising sea-levels, etc. But with respect to effects on human affairs, we are quickly encountering situations and scenarios for which there are no precedents. And even though there were episodes of, e.g., rising sea level or retreating glaciers in the past, those rising seas did not threaten developed coastlines and those glaciers were not water supplies for human settlements.

In addition to examining precedents, we should be looking for analogs. In many cases these will be hotspots of recent and contemporary change that may be bellwethers for more general or global phenomena. For instance, lessons from places such as south Louisiana, where subsidence and other factors create a rate of relative sea level rise greater than the rate of eustatic sea level change, may be crucial in an era of accelerating global sea level rise. Rather than focusing on typical or average glaciers, studies of those retreating most rapidly may provide the most useful information for assessing future impacts of glacial decline.

Freshfield Glacier, Alberta, Canada showing 1964, 1986 and 2014 terminus positions (Mauri Pelto, American Geophysical Union).


This may sometimes go against our training and traditions—after all, most of us were taught and conditioned to seek a holy grail of “representative” sites. We need to shift (or at least broaden) that focus from seeking out sites representative of what was going on until recently, to locations representative of the overheated, rapidly changing world we find ourselves in.

From trajectories to trails

We often speak of past and future in terms of historical trajectories. The formal definition has to do with the path following by an object moving under the action of given forces. The paths and velocities may be inconstant, and trajectories can be modified, but the implication that they are deterministic and covered by (presumably known) rules is entirely consistent with the way Earth and environmental scientists typically think of historical trajectories.

Trails may be a better metaphor for ongoing and future change. While the rules or laws governing development of Earth systems may be constant, the boundary conditions and inputs are shifting rapidly. And the historically and geographically independent rules and laws are not the only thing influencing evolutionary pathways. Trails are influenced and partly constrained by invariant principles, but also by idiosyncratic, historically contingent controls, and potentially affected by a variety of factors that have little or nothing to do with the physics of movement. This, I think, is a better metaphor for the interpretive and predictive problems we face, particularly if (or as) critical thresholds (e.g., a sea ice-free arctic summer; ocean heat absorption; livability of overheated cities) are crossed.


Posted 19 February 2019

OH S#*T

Every day, it seems, there is another news story or reports of yet more evidence that the global climate is changing, either as we have predicted for years—or worse and faster. The climate system is incredibly complex, and climatologists, climate modelers and paleoclimatologists are furiously working to reduce the uncertainty. Despite the uncertainties and complexities, at this point it is clear that:

•Global mean temperatures are rising.

•Ocean heat content is increasing.

•Sea ice cover is, on average, decreasing (both in areal extent and thickness).

Arctic sea ice cover is in serious long-term decline (photo: Huffpost Canada)

•Ice sheets and glaciers are shrinking.

•Permafrost is thawing.

•Sea level is rising. 

•Changes in climate-sensitive biota, ecosystems, and landforms are all consistent with a warming climate. 

•The major driving force is a dramatic increase in heat-trapping greenhouse gases such as carbon dioxide and methane.

High water during a normal astronomical high tide in 2007; Ft. Lauderdale, Florida (photo: https://www.flickr.com/photos/d_himself/1848821193/)

When you look at some of the major feedbacks in the global climate system (which we’ll do shortly), many of them work so as to reinforce the warming trend, and increasingly the instrumental record and observed facts show that is exactly what’s happening. 

So I decided to take a look at the problem—not to determine what is happening or has happened, or to predict climate change, or even to explore various scenarios. Rather, I am looking for a loophole—a pathway or event that could get us out of this doom-spiral, or a previously unheeded beacon of hope. 

I approached this through a technique called qualitative stability modeling, one form of reduced complexity models. Despite our (scientific and societal) fetishism with quantification and numbers, qualitative modeling has advantages for some applications, chief of which is broader applicability. For example, a quantitative model may depend on, say, a specific quantitative relationship between sea surface temperature and tropical cyclone intensity, or between soil moisture content and wind erosion, both of which tend to be quite variable, depending on a variety of other factors that influence cyclogenesis and wind erosion. However, the qualitative relationships—other things being equal, higher sea surface temperatures lead to stronger storms and drier soil to more wind erosion, and vice versa—are universal. The idea of reduced complexity models is to (seek to) gain insight by paring a representation down to its crucial, critical elements. It is certainly a fact that the more variables or factors included in a model or representation, the less general it becomes(and vice versa). 

So here goes. The model has five components—the atmospheric concentration of greenhouse gases (GHG), temperature, the extent of ice cover (land, sea, and permafrost), albedo, and sea level. 

More GHGs (carbon dioxide and methane in particular) lead to higher temperatures. The physics of this have been well known since the 19thcentury, and the fact that it is happening on our planet is well established (and, from the paleoclimate record, it is clear that the direct positive relationship also works for lower greenhouse gas concentrations leading to lower temperatures). Higher temperatures result in thermal expansion of the oceans, and thus sea level rise. They also lead to loss of land and sea ice, the former of which also increases sea level. 

Ice and snow have the highest albedo of any Earth surfaces, meaning that they reflect more and absorb less solar radiation—thus albedo has an inverse relationship with temperatures. Earth’s mean albedo is about 0.31 (on average, 31% of incoming solar radiation is reflected). Fresh snow is about 0.8, and up to 0.9. Sea ice has a typical albedo range of 0.5 to 0.7, and land ice of 0.4 to 0.8, depending on its age, how dirty it is, and how recently new snow may have been added. 

By contrast, land surfaces have albedos of 0.1 to 0.4 (darker surfaces = lower albedo, and vice-versa). The open ocean has very low albedo, ranging generally from about 0.06 to 0.07 (albedo information: https://nsidc.org/cryosphere/seaice/processes/albedo.html)

Thus, when you reduce the cover of land ice and expose ground surfaces, you decrease albedo, increase solar radiation absorption, and increase temperatures. When you reduce sea ice and expose ocean water, you decrease albedo. When you raise sea level and cover ground surfaces with ocean, you decrease albedo. 

You get the idea. 

There is also the fact that thawing permafrost results in release of some carbon dioxide and (especially) methane to the atmosphere, the latter being more than 20 times better (or worse) at trapping heat than carbon dioxide, molecule for molecule. 

Flammable methane is stored in permafrost and released as permafrost thaws (https://allaboutmethane.weebly.com/chemical-properties-and-reaction-tendencies-of-methane.html). 

The diagram shows how the pieces fit together. The arrows are defined on an other-things-being-equal basis. As I tell my students, other things are never equal. But the “other things,” the feedbacks, are meant to be accounted for by the other components and relationships. 

The green arrows in the figure represent the fact that there are other factors, not included in the model, that might either increase or decrease greenhouse gases or temperature. You could also add such arrows to the other model components, but these work mainly at a local rather than a global scale (for example, land subsidence strongly affects relative sea level in Louisiana, but not globally). 

The stability of a model of this type can be determined using the Routh-Hurwitz criteria. To spare you the mathematical details (yes, a model can be both qualitative and mathematical), I have put them in the attached document RHA (for Routh-Hurwitz analysis).  The RHA determines whether a system is dynamically stable, unstable, or conditionally stable. A stable system is resilient to relatively small perturbations, gradually damping them out and returning them toward the previously existing condition. Dynamical instability indicates sensitivity to minor disturbances, which tend to grow disproportionately large and last disproportionately long relative to the trigger disturbance. Conditional stability means the system may be stable or unstable depending on the relative strength of links connecting system components. 

The bottom line is that the system shown here cannot be stable if factors external to the system work to increase greenhouse gases and/or temperatures. However, even if this is not the case, the RHA shows the model is dynamically unstable. This means that changes tend to persist and grow over time, and that the climate system is likely to continue to careen away from the norms that obtained through most of human history and prehistory. 

Oh s#*t. 

From Science Magazine. 


The ray of hope is that it is indeed a dynamically unstable system. Thus the current state of increasing GHGs and temperatures, ice loss, albedo decline, and sea-level rise is also unstable, and thus perhaps vulnerable to changes—such as a serious human effort to not just reduce the growth of atmospheric GHGs, but bring them down, and perhaps other measures to reduce temperatures. 

My conclusion (I hope I’m wrong but I fear I am right) is that we are already past the turning point, and that preparing for the consequences and engineering (not necessarily literally) another turning point are all we have left to do. 


Posted 12 February 2019

Attachments:
RHA.pdf (97.78 KB)

AXIOMS FOR READING THE LANDSCAPE

Just published in Progress in Physical Geography: Place Formation and Axioms for Reading the Natural LandscapeThis work is an attempt to develop some formalisms for analyzing the biophysical landscape from the perspective of place formation--how landscapes, environments, and places evolve and become different from each other. My original efforts were in the form of conceptual model, but (thanks in large measure to reviewers and critiques of earlier versions) I realized that (A) the critical principles could be reduced to axioms, and (B) a set of guidelines or axioms is a more effective (and honest) way to present the approach. The abstract is below:

A copy of the full text is attached.


Attachments:
axioms.pdf (736.73 KB)

EIGHT IS ENOUGH

Eight Simple Techniques for Critiquing Academic Publications

Stuck reviewing an article manuscript, or preparing for yet another graduate seminar? Need to diminish the accomplishments of an annoying colleague or hated rival? Want to appear superior to the others in your roundtable discussion? Want to do these things without having to actually read the whole damn thing? Here are eight simple, effective techniques for providing negative critiques of academic papers, articles, and books.

1. The analysis is oversimplified; the problem is more complex than that.

Of course it is—it’s always more complex. The real world is infinitely complex, and no representation—words, pictures, equations, numbers, diagrams, or otherwise—can capture all of its richness and variety. Thus you can always find something potentially significant the author has omitted, and you can always correctly observe that reality is far more complicated.

2. Deconstructing the binary.

The easiest way to appear thoughtful and astute without actually engaging a piece of work is to challenge the very question or premise it is based on. This is especially easy if the author is using some sort of binary or dualism—quantitative vs. qualitative, nature/nurture, heat or humidity—it doesn’t matter. Indicate that the binary is false and that the real world is more complicated (of course it is—see item 1—and all the more so as dualisms and binaries are devices specifically intended to simplify it). It’s not really about A vs. B, it’s a continuum from A to various shades of A & B, to B. Or, it’s not really about A vs. B, it’s about X vs. Y. Or apples, oranges, and pears. Whatever.

3. Contested concepts.

Appearing thoughtful and astute without actually engaging the work is only a little harder if no binaries are involved—simply assert that the concept being investigated is “contested.” Somebody, somewhere, sometime has disputed the very concept of, say, climate or cities or germs or anything else. A quick web search will turn it up for you, and you can dismiss the work (or make your discussion of it appear more nuanced) by noting that the very premise is contested.

4. Why didn’t they use another method?

This is a timeless classic. There are always, always, multiple plausible ways to address or analyze anything. Whichever the author used, pick one of the others (again, five minutes online will generally turn this up for you). Then, if you are feeling charitable, raise the question of whether the alternative approach was considered. If you’re feeling feisty ask why the other method was not used, in a tone that suggests that it would have worked better.

5.  Find a precedent.

This is a little more work, but a good one if you just want to mess with someone. Anything that exists, or appears to exist, has been noted and commented upon by some observant person somewhere, sometime. A bit of digging will allow you to turn up some mention earlier than the earliest source cited by the author. Then you can wag your finger at them for not crediting the pioneering work of this early innovator. This one is especially sweet if you can find one in another language, as it allows you to appear innately superior to the insulated, monolingual chauvinist you are critiquing.

6.  Hell, you already knew that.

In this approach, you concede the truth or validity of the author’s arguments, but indicate that they are self-evident and therefore trivial, or already known (careful with this one, though as it may involve background work). Good adjectives to use for these critiques: unsurprising, conventional, banal, trite, hackneyed, hoary.

7. Not a panacea.

Arguing that the author’s proposal, solution or approach is “not a panacea” is sure-fire in that you cannot be wrong. There are no panaceas, and rarely, if ever, does an author make such a claim. It is, however, somehow still legitimate in this instance to critique something for its failure to be a thing that does not exist.

8. Missing mentions.

No one can possibly engage or cite everything that has been written—or even everything that shows up in electronic databases—on a given topic. Spend a few minutes on one of those databases, and find a few things the author did not cite. Then (gentle version) ask why the apparently relevant work of so-and-so was not cited. Or (rough version), go out on a limb and sneer that the author is apparently unaware of the (seminal, fundamental, canonical, etc.) work of so-and-so.

Tags: