
Blogs

CRISES & OPPORTUNITIES ON INFINITE EARTHS

Some incomplete thoughts and notes on Earth surface system (ESS) evolutionary pathways, focusing on how to think about the enormous variety and large number of possibilities.


ESS encompasses geomorphic and soil landscapes, hydrological systems, and ecosystems. There exists a huge variety of them on our planet. Assuming we could ever inventory or even estimate them all, we can define NESS  as the number of ESS. For each of these multiple possible evolutionary pathways exist. So we define

Ni(p) = number of possible evolutionary pathways for each of i = 1, 2, . . . , NESS.

Image credit: Turbosquid.com

At any given point in history there were multiple potential evolutionary possibilities, such that Nglobal(p) = number of total possible pathways = Σ Ni(p). However, only one history has occurred for each individual ESS, so that the number of actual past pathways now manifest = NESS.

Canalization is the phenomenon whereby the occurrence of a specific evolutionary trajectory or event constrains (and thus channels or canalizes) future possibilities. For instance, prevention or non-occurrence of fire forecloses post-fire forms of ecological succession unless or until a fire eventually occurs. Incision of stream channels in certain locations restricts or prevents their formation at other locations within the system, and directs fluxes of water, sediment, and nutrients. If Ni(f) is the number of possible future evolutionary pathways, Ni(f) < Ni(p) due to canalization. We could use this to define a canalization ratio, and even conceptualize a global ratio.

Canalization could result in either problems or opportunities by constraining and guiding evolution.


STRUCTURAL REDUNDANCY IN BIOGEOMORPHOLOGY

In ecological systems, structural redundancy refers to the extent to which more than one species (or taxanomic group) can perform a given function or play a given role in the system. Microbial communities or ecosystems, for instance, tend to have high structural redundancy at the species level, as there usually exists multiple bacteria or other microbes that can, say, break down specific forms of organic matter, reduce iron, precipitate calcium, or what have you. Systems with a single keystone species have low redundancy, at least with respect to whatever the keystone organism does (if something else could perform the same function, then it would not be a keystone). Redundancy tends to be inversely correlated to the degree of biotic specialization, and directly related to ecosystem resilience. 

Tasnuba Jerin (Jerin, 2021; Jerin and Phillips, 2020) linked redundancy to biogeomorphic ecosystem engineering via the concept of biogeomorphic keystones and equivalents. Biogeomorphic keystones perform a unique role such that their removal from or addition to a geomorphic system results in a transformation or state change. Equivalents are different taxa that can do the same biogeomorphological job, and indicate redundancy. Many different kinds of grass or tree, for instance, can provide more or less similar functions with regard to erosion resistance or substrate stabilization. However, no other species performs the same biogeomorphic role as the biogeomorphic keystone species Castor canadensis (beaver). The same species may be a keystone in some settings but not others—for instance, in Tasnuba’s work Platanus occidentalis (sycamore) is a keystone in some bedrock streams where it forms unique pools, but generally not otherwise. 

Adorable baby beavers on their lodge in the lower Neuse River floodplain, North Carolina.

But let’s take a look at structural redundancy in geomorphology more generally. In some cases it is not very fruitful to think about redundancy. For example, aeolian sediment transport is accomplished only by wind, and fluvial erosion only by flowing water, and the disappearance of those processes (or their initiation where once absent) would be part of a larger story that is not enriched by thinking about redundancy. One could, of course, think about, say, sediment transport and identify multiple processes that can accomplish that—mass wasting, flowing water, waves, wind, ice. But while the transitions among sediment transport process dominance and the possible combinations thereof are interesting and important, I can’t see how thinking in terms of structural redundancy helps our cause (but I am prepared to be convinced otherwise!). 

A possible exception is weathering processes. Carbonate dissolution in karst, for example, has high biogeomorphic structural redundancy. Hydrocarbonate dissolution requires a CO2 subsidy from soil and ground-dwelling biota. But any respiring plant, microbe, or animal can accomplish that. While the amount and rate of CO2 subsidy matters, it makes no difference which organisms provide it. The same goes for bacteria that process iron (oxidation or reduction), as multiple species can perform that function (biogeomorphic equivalents or functional groups). 

Sticking with karst, in central Kentucky an important process is woody root penetration into limestone joints and fractures, where a combination of microbial activity in the rhizosphere, formation of organic acids, funneling of water into the rock, and pressure exerted by root growth helps break down the rock. Only two species (in that region) seem to do this ubiquitously—Quercus muehlenbergii (chinquapin oak) and Platanus occidentalis. This process thus seems to have limited structural redundancy, as root penetration of rock by other plants is less frequently observed and their root growth within the rock is less extensive (Phillips, 2016 and this).

Chinkapin oak displacing limestone in central Kentucky.

Sycamore root in bedrock joints, central Kentucky. 

This issue may become more urgent as climate changes, and biogeography along with it. In the U.S. Atlantic and Gulf Coastal Plains, for instance, bald cypress (Taxodium distichum) fulfills several geomorphic roles (in addition to its ecological roles) that few or no other species can fulfill. Evidence suggests that sea-level rise is resulting in gradual replacement of cypress with tupelo gum (Nyssa aquatica) as salinity and tidal conditions encroach further upstream (e.g., Peterson and Li, 2015; Tallie et al., 2019). The trees are similar in some respects--both are capable of growing, once established, in perpetually standing water but both require non-inundated conditions for seed germination and seedling survival; both typically develop wide buttressed trunks. But they differ in geomorphically significant ways. Taxodium produces above-ground roots (cypress knees) that are very effective for erosion protection in some settings, and is more prone to uprooting. Nyssa decays faster, is more likely to sprout from stumps or form coppiced trunks, and is more prone to breakage (as opposed to uprooting), all of which are important with respect to large wood and organic matter dynamics. Biogeomorphic structural redundancy is thus quite low in lower coastal plain floodplain swamps. 

Tupelo gum swamp, Turkey Quarter Creek, North Carolina

References:

Jerin, T. 2021. Scale associated coupling between channel morphology and riparian vegetation in a bedrock-controlled stream.Geomorphology 375, 107562.

Jerin, T., Phillips, J.D. 2020. Biogeomorphic Keystones and Equivalents: Examples from a Bedrock StreamEarth Surface Processes and Landforms 45, 1877-1894.

Peterson, A.T. & Li, X. 2015. Niche-based projections of wetlands shifts with marine intrusion from sea level rise: An example analysis for North Carolina. Environmental Earth Sciences 73, 1479–1490. 

Phillips, J.D., 2016. Biogeomorphology and contingent ecosystem engineering in karst landscapes. Progress in Physical Geography 40: 503-526.

Taillie, P.J.,  et al. 2019. Decadal-scale vegetation change driven by salinity at the leading edge of rising sea level. Ecosystems 22, 1918–1930. 

Comments or questions?   jdp@uky.edu

NEUSE NEWS: FLUVIAL-ESTUARINE TRANSITION ZONE

Just published in Earth Surface Processes and Landforms (vol. 47, p. 2044-2061): Geomorphology of the fluvial-estuarine transition zone, lower Neuse River, North Carolina. The abstract is below and the article is attached. 


Attachments:
Neuse FETZ .pdf (31.27 MB)

STORE & POUR

Just published in Catena: Store and Pour: Evolution of Flow Systems in Landscapes (vol. 216, paper number 106357). The abstract is below, and the article is attached.

This continues my effort to figure out why certain "optimal" configurations appear recurrently in nature, despite the fact that most environmental entities have no intentionality, and that these must be emergent phenomena--accidental agency, if you will. This recognizes some similarities in the development of flow systems in terms of dual-porosity in soil and groundwater (preferential flow patterns and matrix), dendritic fluvial channel networks, and other hydrological (and related geomorphological and ecological) phenomena. It's really pretty simple, as reflected in the figure below (Fig. 4 from the published paper).


Attachments:
store&pour.pdf (12.41 MB)

TALKING JUNCUS

Juncus romerianus or black needlerush is a graminoid plant that grows in coastal marshes from Virginia down the southeastern coast and around the Gulf of Mexico to Texas. It has high salinity tolerance and is often found in salt marshes, but can grow in near-about fresh water and everything in between. It has no direct, consumptive economic use that I know of (though in pre-industrial times it was used as a needle; hence the common name). However, anecdotal evidence from my neck of the woods suggests that it is highly resistant to erosion and perhaps a good candidate for “living shoreline” erosion control and wetland restoration. 

Juncus roemerianus near my house.


A quick-and-dirty literature search didn’t turn up anything on marsh fringe erosion or erosion resistance focused on needlerush, though there is plenty of field and experimental evidence of its efficacy in trapping sediment and promoting deposition. I have seen it eroded away where it becomes undermined, and the surface layer it is rooted in collapses. 

However, anecdotal observational evidence shows that it is quite resistant to erosion, often persisting even as adjacent coastal landforms and vegetation is eroded away. 

The evidence comes from the Neuse River estuary, North Carolina. One example is at Fisher’s Landing near New Bern. The three photos below show three small patches of Juncus romerianus before, immediately following, and about a year and a half after Hurricane Florence in September, 2018. In the first of the sequence the Juncus patches (which according to Google EarthTM images had been there for at least 20 years previously) are highlighted by rectangles. Note the end of a granite boulder rip-rap at the bottom. The second is from a few days after Hurricane Florence. While the approximately 10 m tall bluffs have retreated 10 m or more laterally, the needlerush patches remain (the middle, small one is hard to see in this image, but it is there). And they are still there in the later image. Note that you can’t infer too much about the beach widths shown. Water levels here are highly sensitive to wind, with water levels going way out during strong SW winds, and coming way up in strong NE winds, so visible changes don’t necessarily reflect any erosion or accretion. The middle image does show a temporary increase in beach width due to onshore transport of sand during Florence, and sand added from erosion of the adjacent bluffs. The new wide beach was gone in two years. 

Fisher’s Landing, February 2017 (Google EarthTM image)

Fisher’s Landing, September 2018 (Google EarthTM image)

Fisher’s Landing, March 2019 (Google EarthTM image)

Now we go downriver a few km to a patch of Juncus near my house. It has been there since at least 1985 (the earliest photo I could find with sufficient resolution). I have personally observed it since 1990, and it never appeared to casual observation to significantly increase or decrease in size. I recently measured it with a survey tape; its area was right at 26 m2. I am not confident comparing field measurements to areal measurements from imagery, but if anything, the size of the patch has increased. Estimates using Google Earth’s polygon measuring tool on images from 1993 to 2019 give results of about 15 to 22 m2

Juncus patch, showing the obvious sediment-trapping effects.

Part of my elite field research team.

The needlerush patches survived Florence, but during the phenomenal 4 m storm surges then the Juncus was totally submerged. But they survived battering during the rise and fall of the storm surge, and at least seven other hurricanes, and countless northeasters. Nearby (within 30 m) dense patches of sawgrass (Cladium Jamaicense) were wiped out by Florence, and the common reed (Phragmites australis)—a famously, some would say notoriously, resistant marsh plant--that replaced it has been eroded back in subsequent northeasters, As the needlerush can obviously resist erosion, it raises for me the question of why the patches have not been able to expand to any great extent.

Juncus patch at low water.

My shoreline fringe wetland observation station. 


CHANNEL EVOLUTION & FLOW-CHANNEL FITNESS

In 2013 I developed and published something called the flow-channel fitness model (FCF; Phillips, 2013; attached). Fitness refers to the fit between channel size or conveyance capacity—yes, it’s a problematic concept, but a venerable one in hydrology and geomorphology. Underfit channels are “too large” for the range of flows they typically convey. They often occur where large channels and valleys were formed during previously wetter climates, or by megafloods or glaciers, with those big ‘ol channels now occupied by smaller streams that rarely overflow their banks and can’t do much to reshape the channel. Overfit channels are “too small.” They frequently can’t hold all the discharge that comes their way and flood frequently. Fit channels, at least as conventionally conceived for alluvial channels in humid climates, have a reasonably good match. They flood (on average and according to the conventional wisdom) every year or two but otherwise hold their water.

The FCF model is a conceptual and practical model for predicting the qualitative response of alluvial channels to modifications of flow regimes—that is, whether channels experience aggradation, degradation or relative stability, and whether aggradation or degradation is dominated by width or depth. The model is based on transitions among seven possible fitness states, triggered by key thresholds of sediment supply versus transport capacity and shear stress versus shear strength, and requires that potential changes in sediment supply and water surface or energy-grade slope also be accounted for. The summary table and diagram from that paper are shown below. 

I stand by the FCF model, at least in the context for which it was devised, and recognizing that while criteria are simple (fitness, sediment supply vs. transport capacity, shear stress thresholds) they are hardly easy to deal with in terms of measurement or change over time and space. I decided to revisit it, however, to ignore the problematic fitness concept (in part because I’ve dealt with so many lower coastal plain streams that flood frequently under any circumstances and for which overfit and fit are irrelevant). While the FCF is essentially a state transition model, recognizing and (ideally predicting) changes among states, I wanted to think a little more about some of the interrelationships within the system and possible changes. 

The first iteration is shown below. Where sediment supply exceeds transport capacity, the key question is whether there exist opportunities for alluvial storage in channels, subchannels or abandoned channels (oxbows, sloughs, etc.), or floodplains. If so, aggradation occurs.

Flow-channel fitness model (see attached article)

Channel evolution model 1.0

Infilling sub-channel, Navasota River, Texas

If insufficient storage is available, the channel begins to clog with sediment. This can be the first step of infilling, or can trigger feedbacks such as avulsions, cutoffs, or situations where increasingly large flows are confined within ever-higher banks until thresholds are exceeded and erosional stripping occurs. If sediment supply is less than transport capacity, the available sediment is transported through the reach, either with or without channel erosion, depending on whether the mean boundary shear stress of flow exceeds the critical stress for channel and bank erosion (this also applies to aggradation with or without erosion, but I didn’t want to make the flow chart too busy at this point). 

True steady state in alluvial rivers is rare and transient, but a situation with no significant net erosion or aggradation can appear to be in steady state. 

Eroding channel, Board Camp Creek, Arkansas.

Apparent steady state (no net erosion or aggradation), Guadalupe River, Texas. 

Now let’s think about what aspects of the system are most likely to change as a result of external (to the fluvial system) factors such as climate change, sea-level rise, dams, flow diversions, and modifications to watershed runoff and erosion due to climate, land use, or vegetation change. These are highlighted below.


Channel evolution model 1.1, with factors most vulnerable to external change highlighted.

But wait. Aggradation can occur without or with channel erosion (for example, point bar/cutbank pairs on meandering alluvial rivers. 

Aggradation with erosion, Sabine River, Louisiana/Texas.

Aggradation without erosion, also Sabine River. 

Channel evolution model 2.0, including aggradation with or without erosion. 

But wait. Again. We have not considered the internal feedbacks in the system. The version below includes some of these. Eroding channels as well as cutoffs and avulsions affect sediment supply. Aggradation influences sediment storage capacity, and channel erosion affects the shear stress ratio on both sides—by modifying channel geometry and thereby affecting shear stress, and by potentially exposing materials of differing resistance (and also removing or modifying bank or channel vegetation or debris). This is reflected below. 

Channel evolution model 3.0. Dashed lines show internal feedbacks. 

So what now? Where do we go from here? I don’t know, at least not yet. I am putting this out there in hopes that it may help others think this through, in case I don’t get around to pressing it forward. 


Attachments:
rra2602.pdf (1.13 MB)

THE FIRST LAW

Everything is connected to everything else has been called the First Law—of ecology, of geography, and of environmental science. But why do environmental systems become so highly connected, and generally remain that way? Not quite satisfied to just say that's the way it is, and following Aristotle, who said that nature does nothing without purpose, I've been working on an answer to the why The First Law holds. I've produced a manuscript on this called Why Everything is Connected to Everything Else, abstract below, and attached to this post. I'm calling this a preprint, in hopes that it may eventually be published somewhere. But experience suggests that my odds of getting into a scientific journal are not great. Comments, criticisms, and corrections are welcome. 

Abstract

In Earth surface systems (ESS), everything is connected to everything else, an aphorism often called the First Law of Geography and of ecology. Such linkages are not always direct and unmediated, but many ESS, represented as networks of interacting components, attain or approach full, direct connectivity among components. The question is how and why this happens at the system or network scale. The crowded landscape concept dictates that linkages and connections among ESS components are inevitable. The connection selection concept holds that the linkages among components are advantageous to the network and are selected for and thereby preserved and enhanced. These network advantages are illustrated via algebraic graph theory.  For a given number of components in an ESS, as the number of links or connections increases, spectral radius, graph energy, and algebraic connectivity increase. While the advantages (if any) of increased complexity are unclear, higher spectral radii are directly correlated with higher graph energy. The greater E(g)is associated with more intense feedback in the system, and tighter coupling among components. This in turn reflects advantageous properties of more intense cycling of water, nutrients, and minerals, as well as multiple potential degrees of freedom for individual components to respond to changes. The increase of algebraic connectivity reflects a greater ability or tendency for the network to respond in concert to changes. 

Do a online search for images related to "everything is related to everything else," and you will find a lot of inspirational posters with quotes from famous people. This is one of them. 

Attachments:

FROM WHENCE COMETH THE MUD?

Some recent kayak trips on the North River near Beaufort, NC (which, naturally enough, is north of North River, SC, but strangely enough well south of the other North River, NC, and even more strangely, south of the South River in the same county) revived some nagging questions about the source of sediment to coastal marshes. 

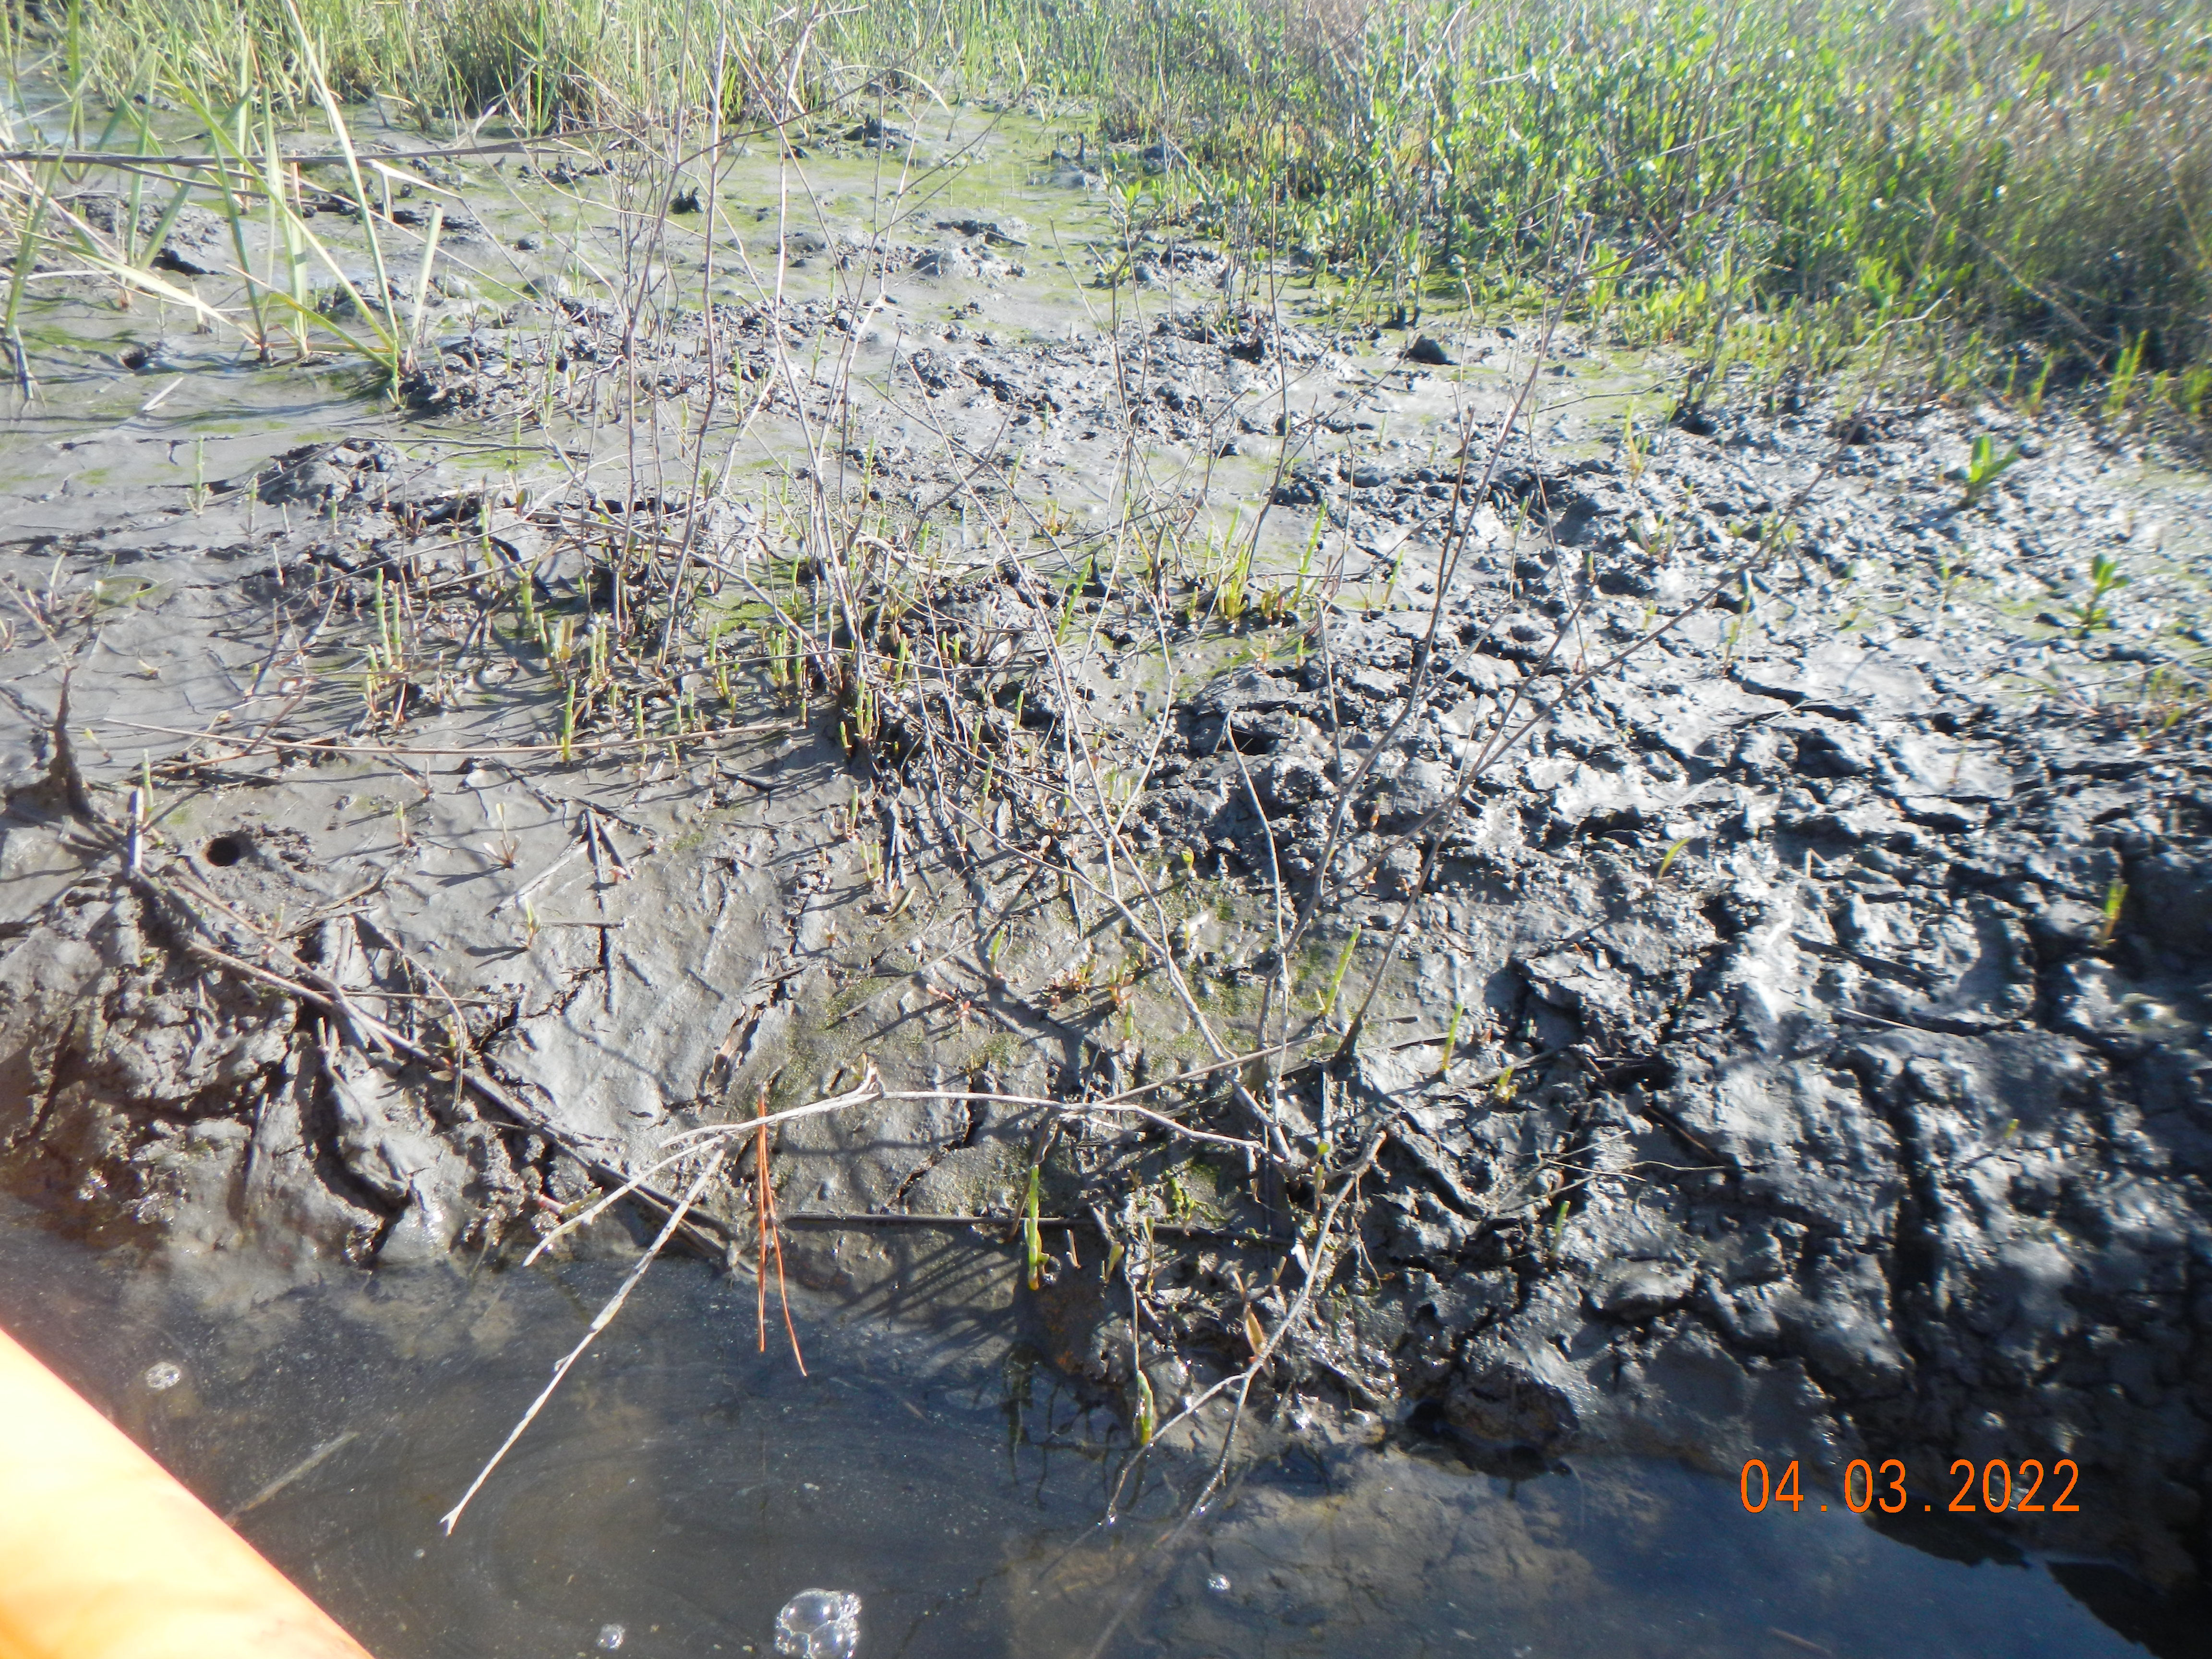
Freshly deposited mud on the North River marshes.

Most of my work in this context has dealt with larger rivers on the Atlantic and Gulf Coastal Plains (drainage basins >15,000 km2) addressing (among many other things) how much fluvial sediment is delivered to estuaries and coastal wetlands, and where within those drainage basins it comes from? Some updates and reminiscences were covered in this post. Essentially, my work (and many others) has found that in many river systems much of the sometimes-considerable sediment loads from the upper watersheds never reaches the coastal zone, being stored as alluvium in lower river reaches. Much of what does reach the coast derives from coastal plain sources near the coast, not from upriver. 

Algal biofilm (and mussel shells from river otter meals) is visible at this spot where ebb tide flows have high enough velocity to inhibit deposition. 

But coastal wetlands, some extensive, occur in areas where there is very little upland runoff and sediment contributing area at all. At least some of these are not only getting sediment deposits, but also getting enough to keep pace with rising sea-level. Where is this marsh mud coming from? Let’s take a look at that, using North River as an example.

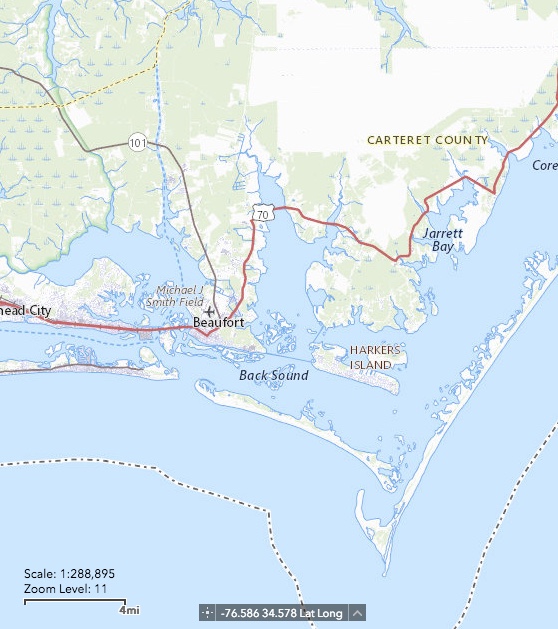
North River (center of map), as shown on U.S. Geological Survey’s National Map.

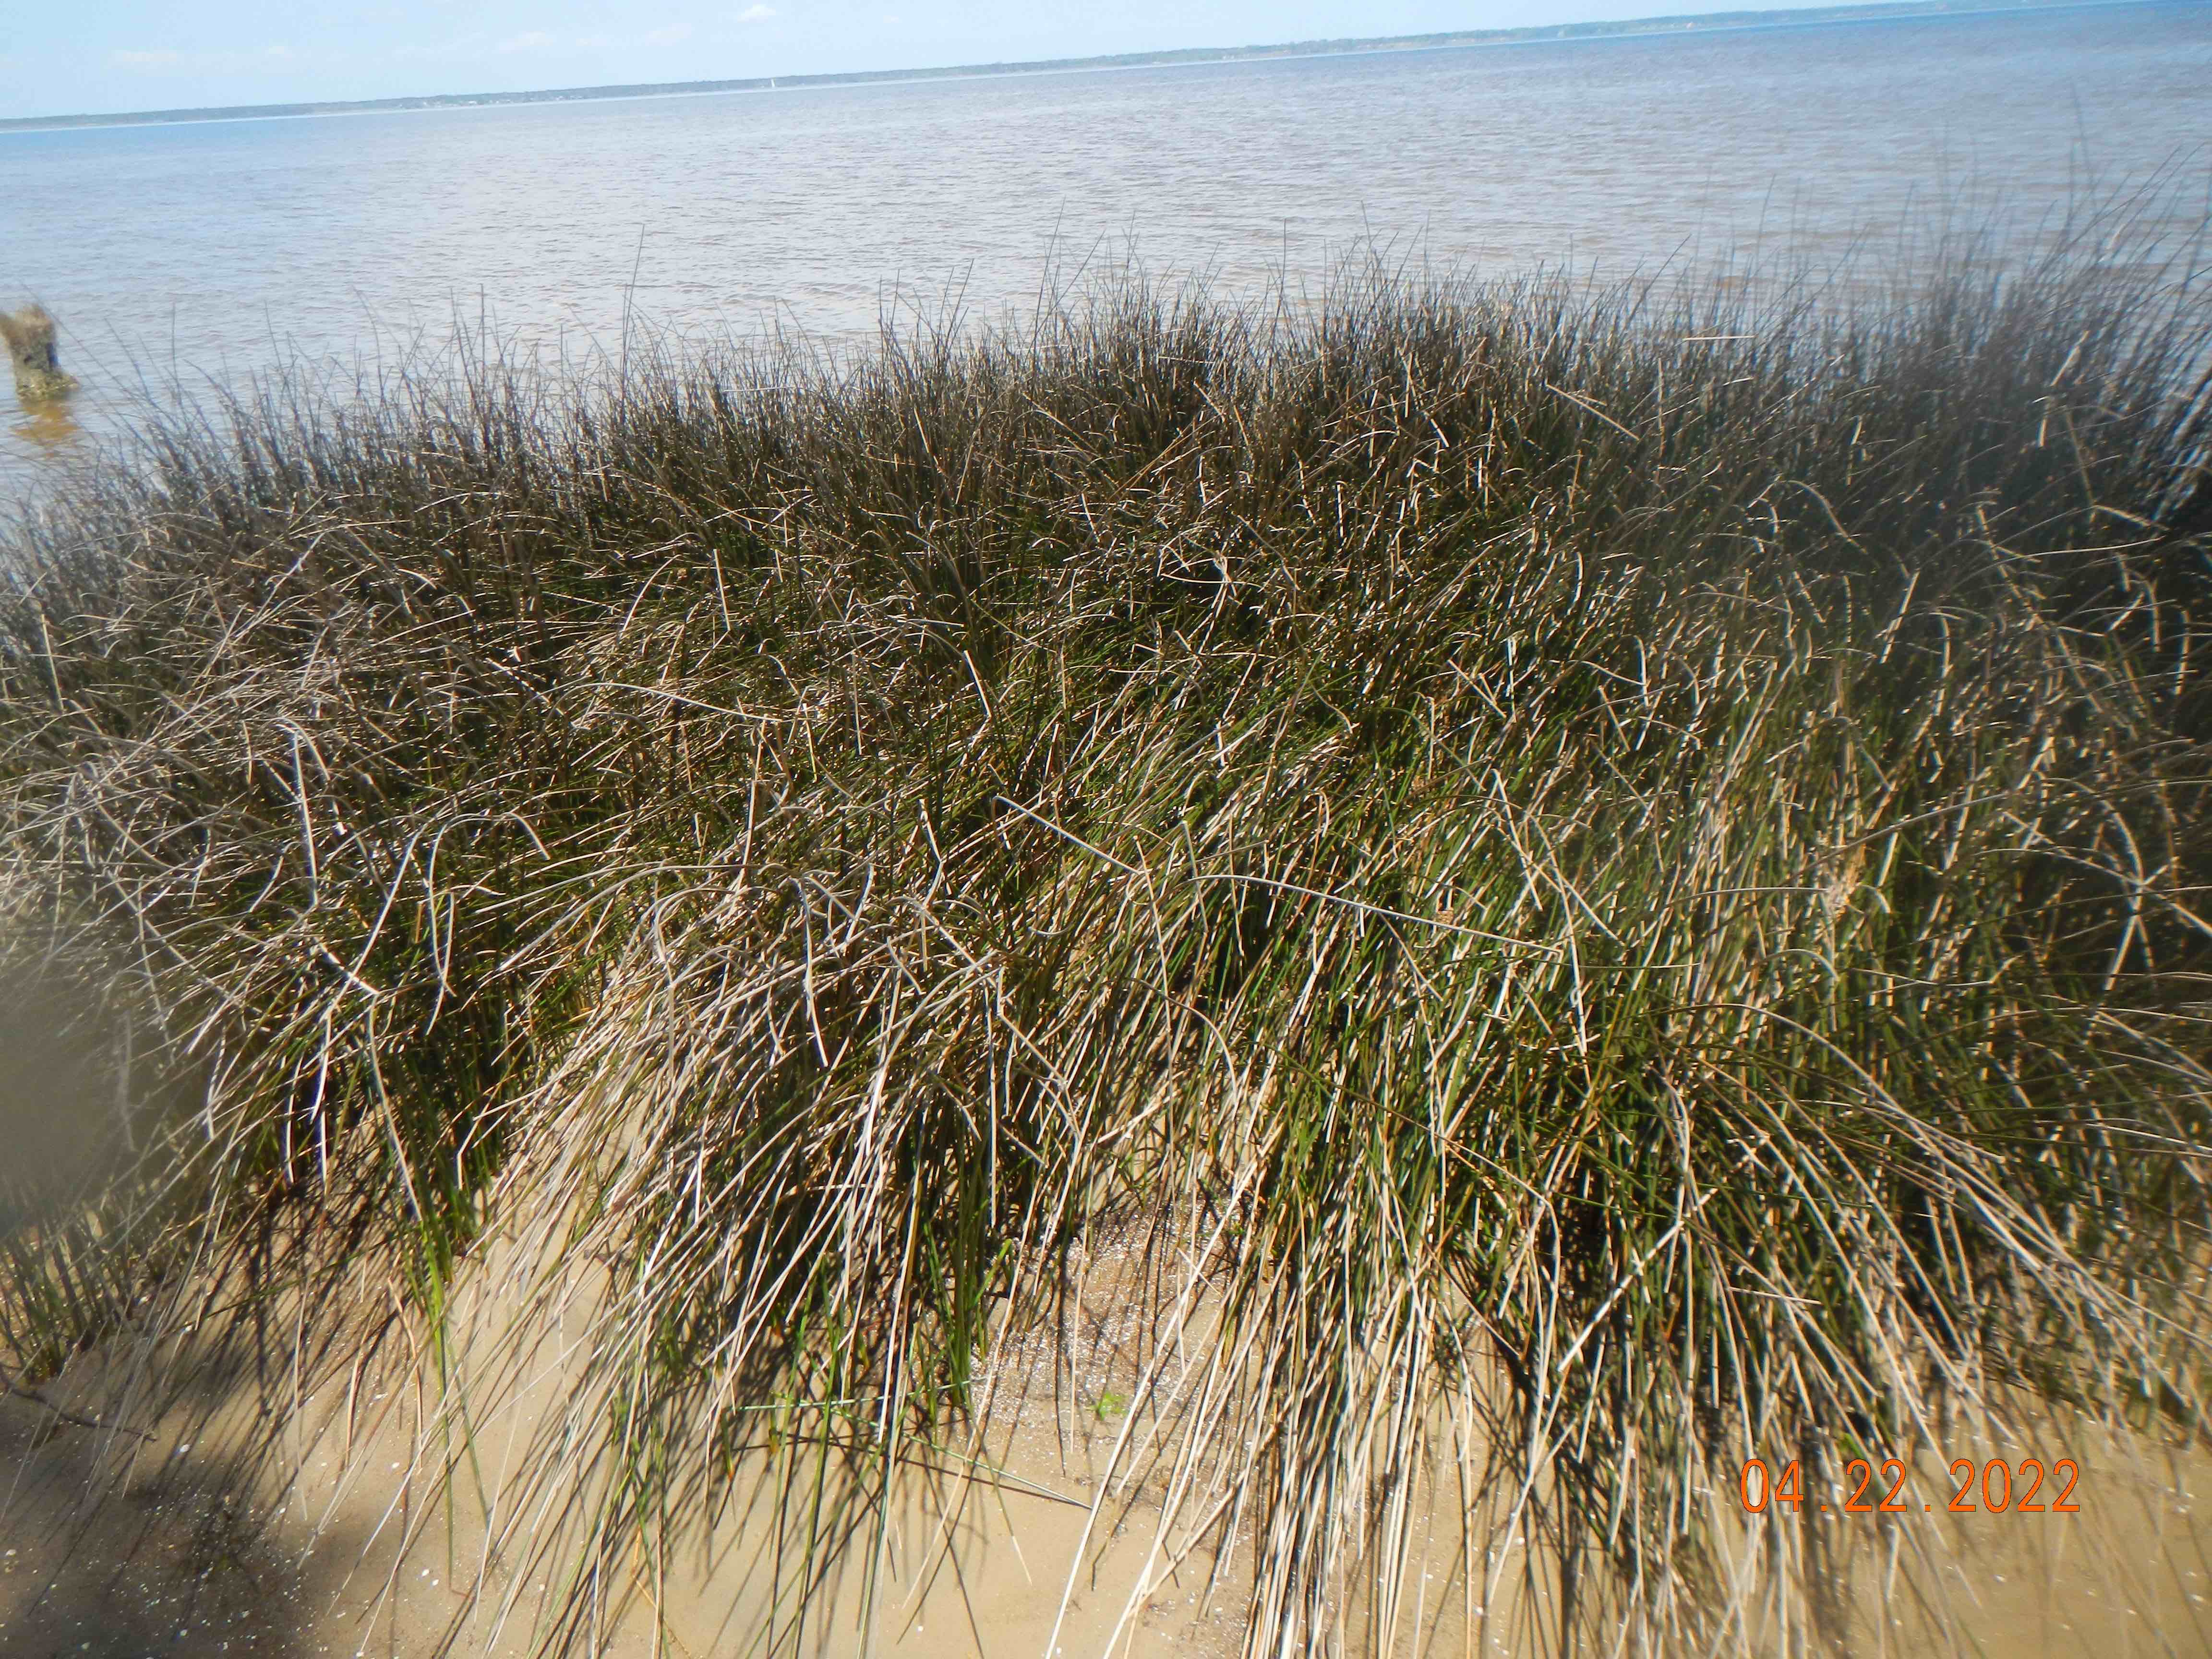
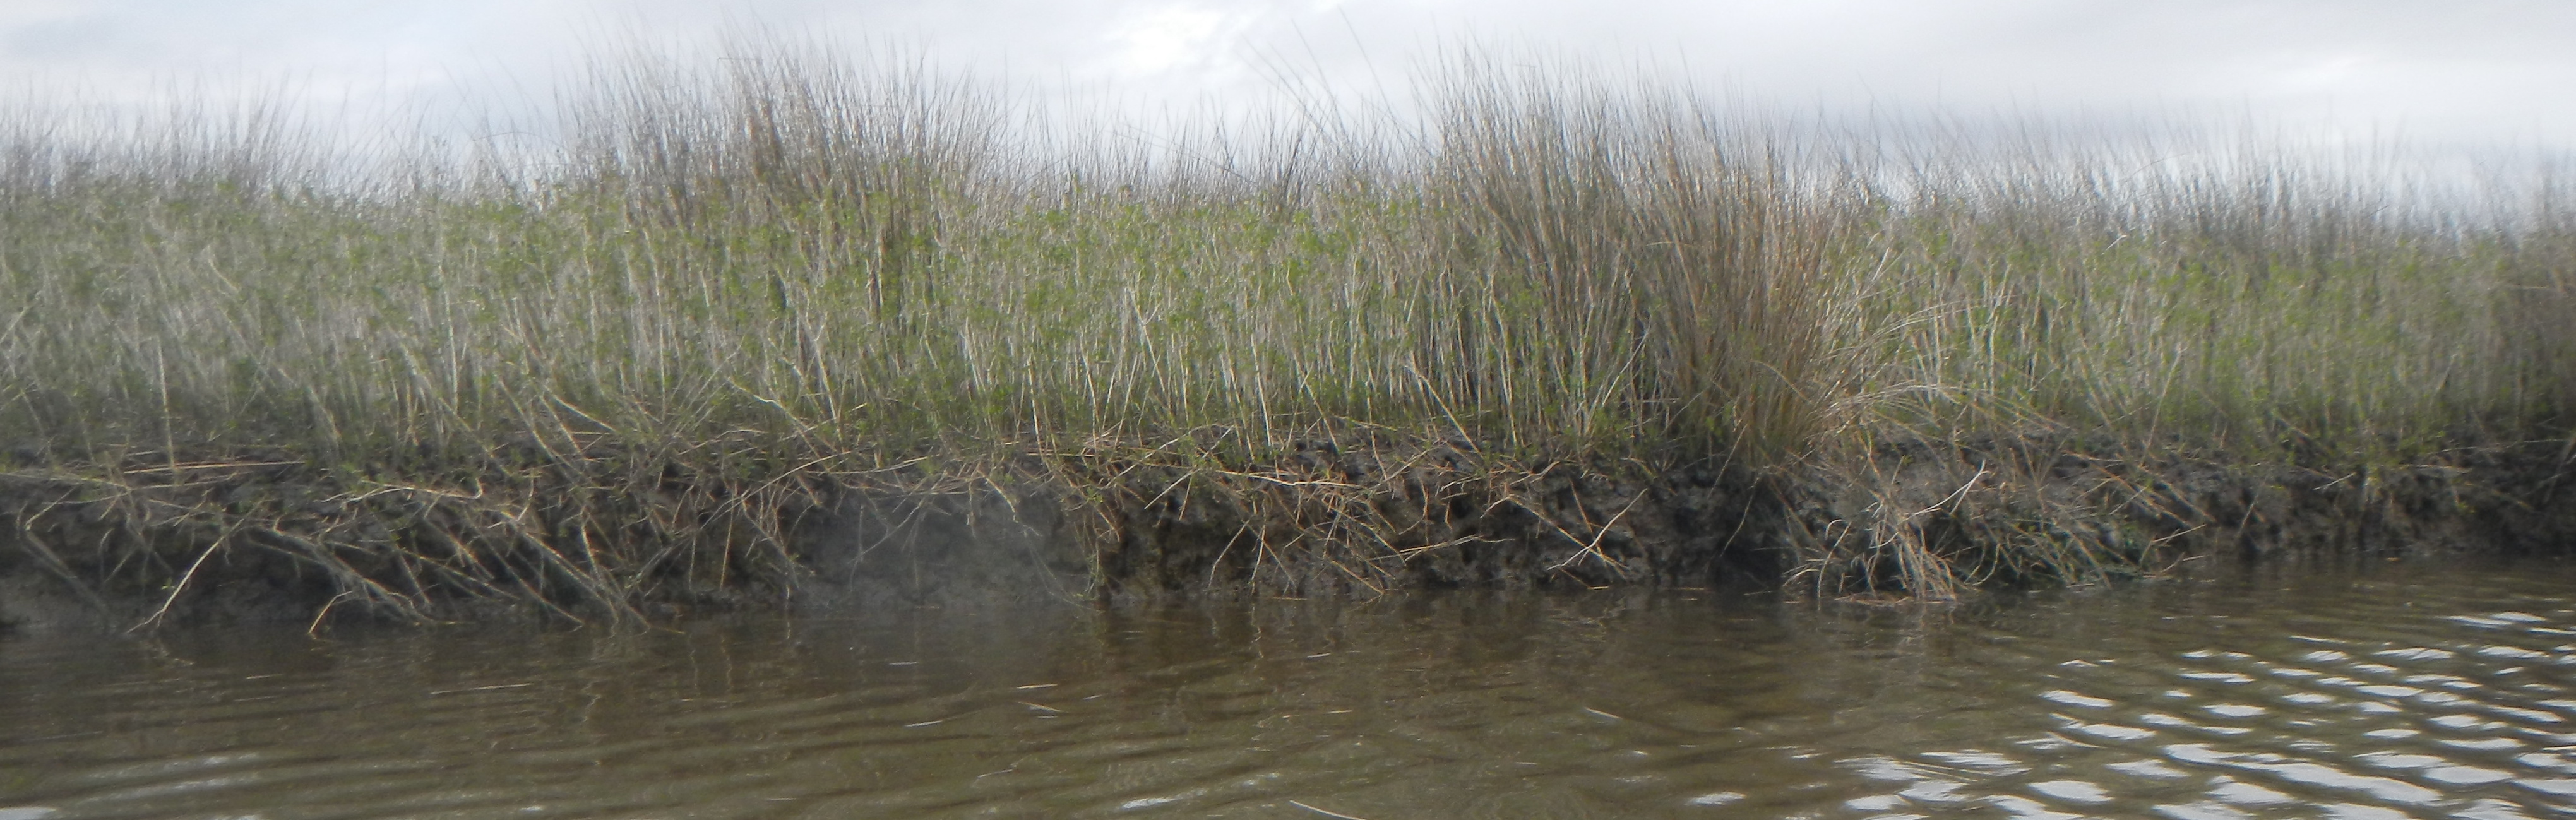
North River is a small estuary in Carteret County, tidal along its entire length (<15 km to Core Sound). The drainage area is hard to ascertain, because a number of drainage ditches and canals obscure the natural drainage patterns and reroute flow paths. However, the freshwater drainage area is minimal, and astronomical tides are the main source of water flux in the marshes. In the upper North River (upstream of the U.S. highway 70 bridge) the marshes are dominated by black needlerush (Juncus roemerianus). Saltmarsh cordgrass (Spartina alterniflora) occurs along some bank/shoreline fringes and low spots. A handful of other regionally typical salt-tolerant species occur. Groundsel bush (Baccharis halimifolia), which has long been present, appears to have recently expanded and seems to continuing expansion, dominating some patches and snuggling in with Juncus along many banks. 

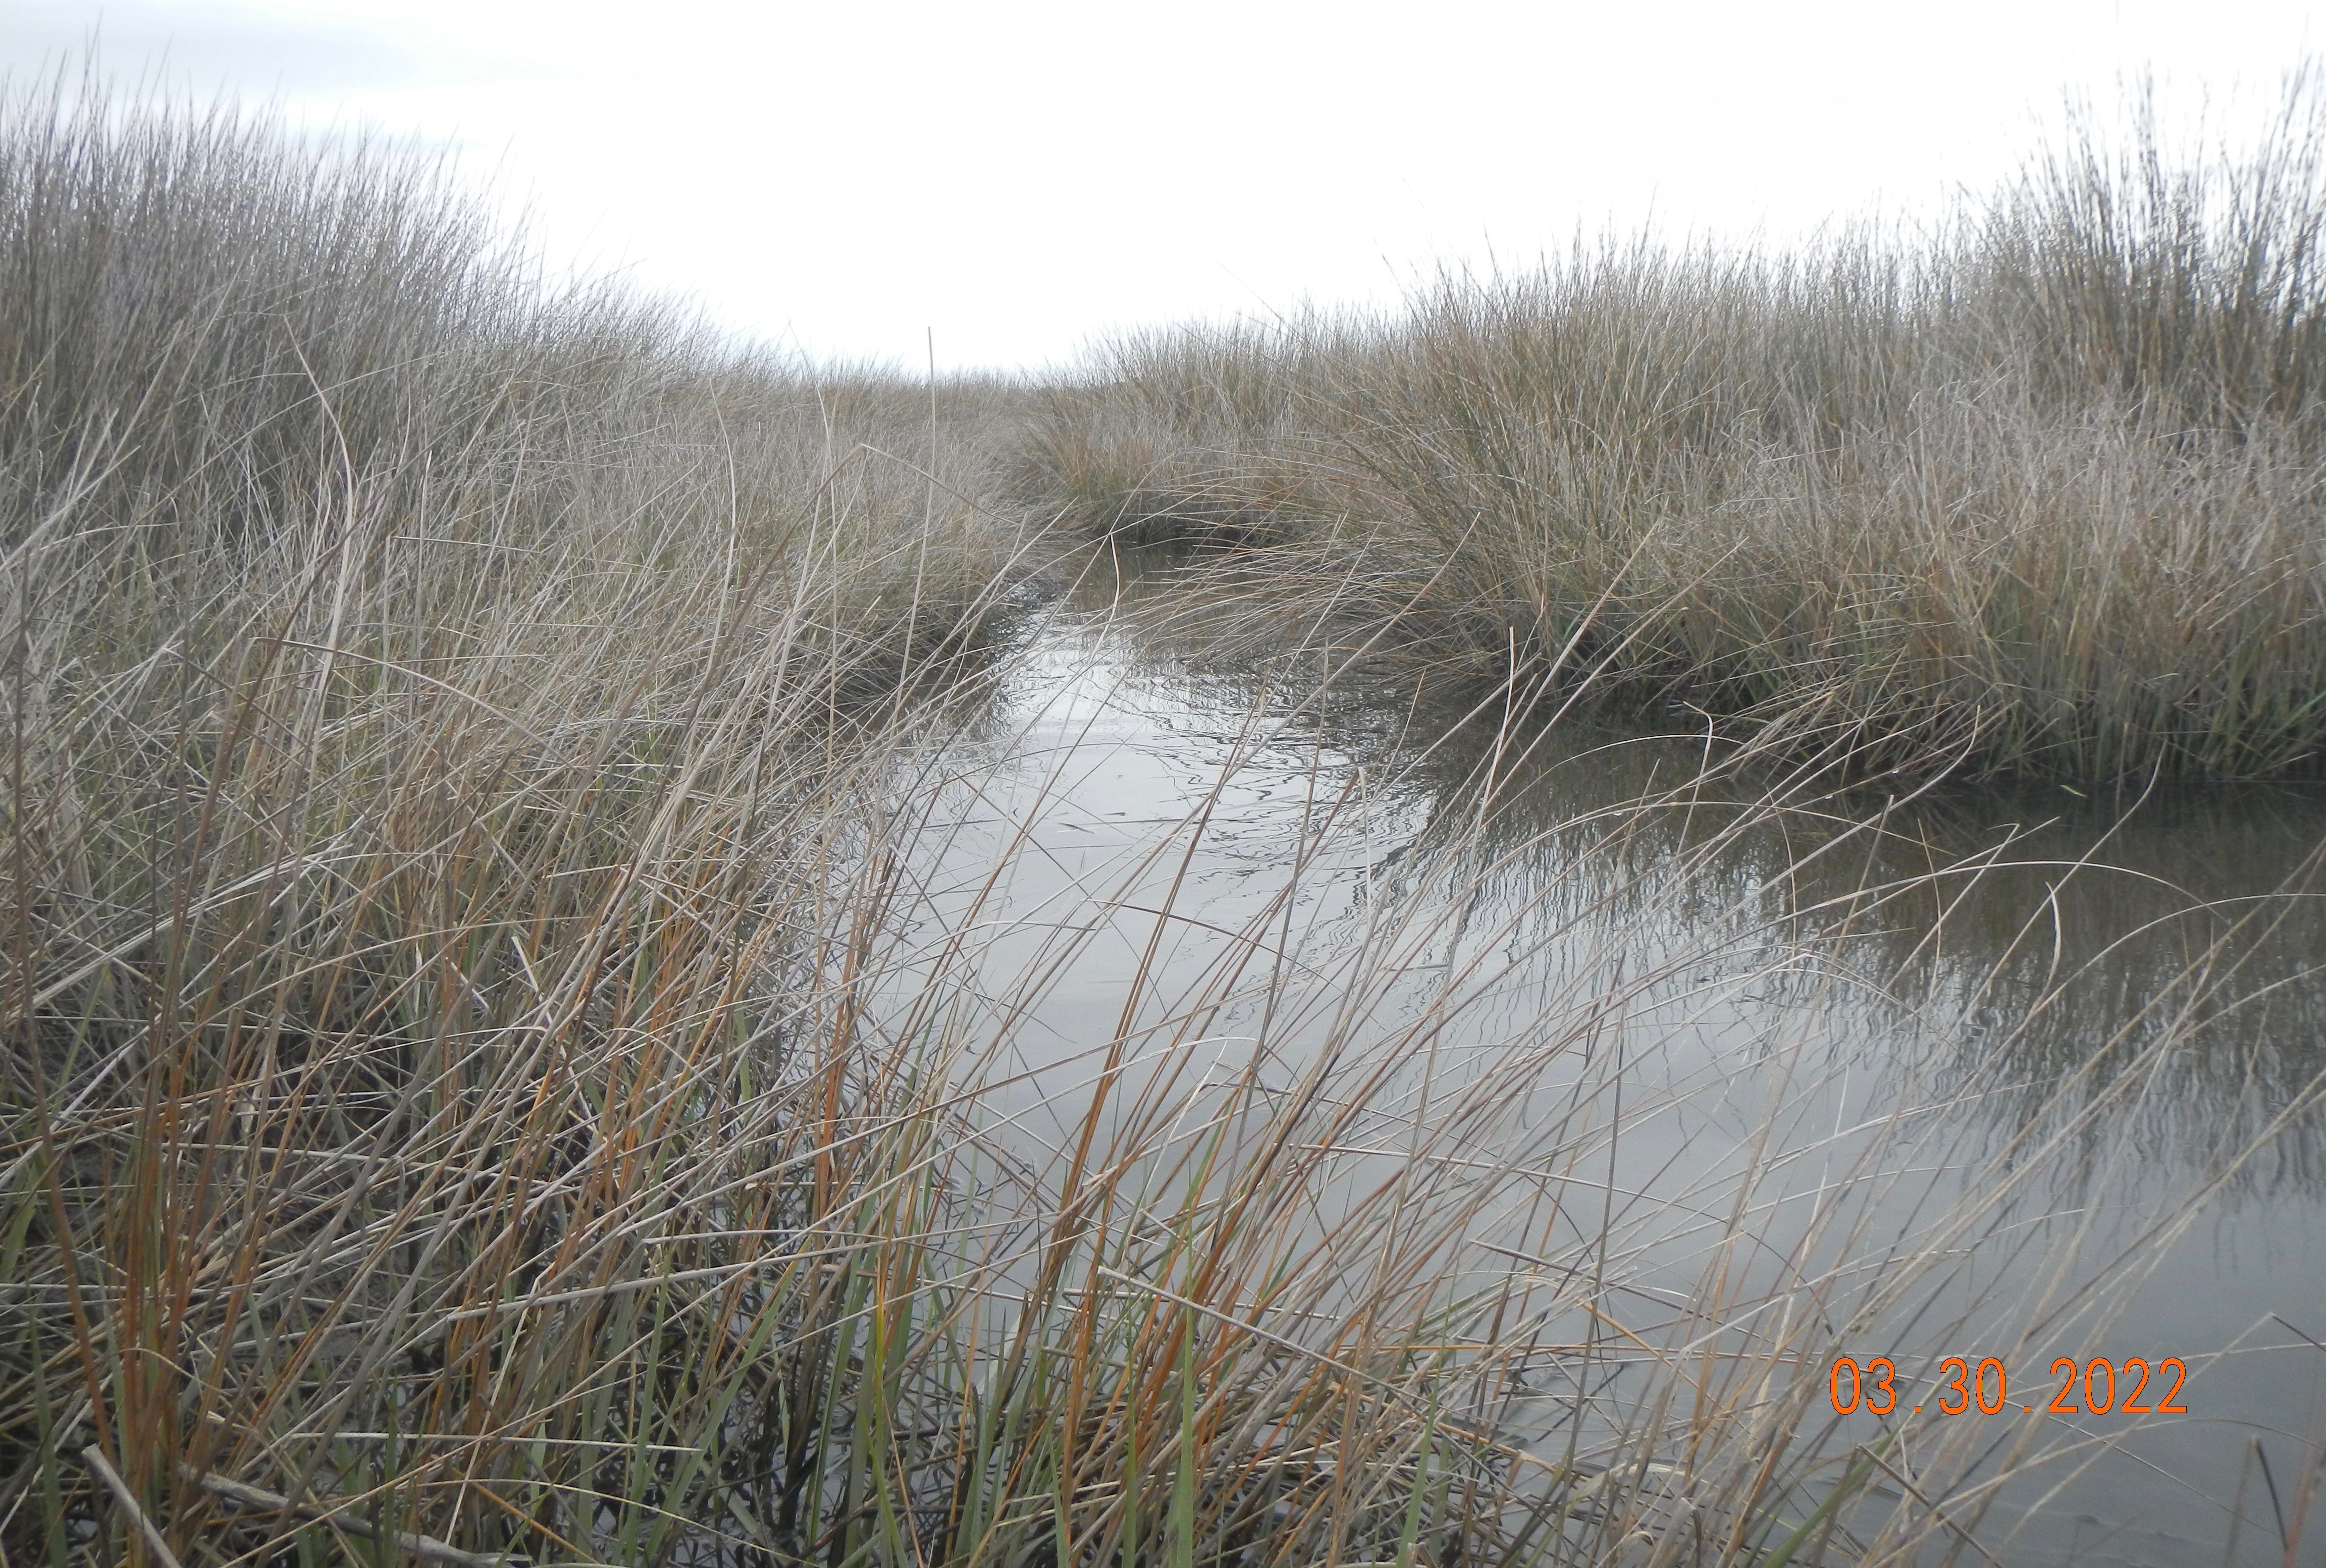
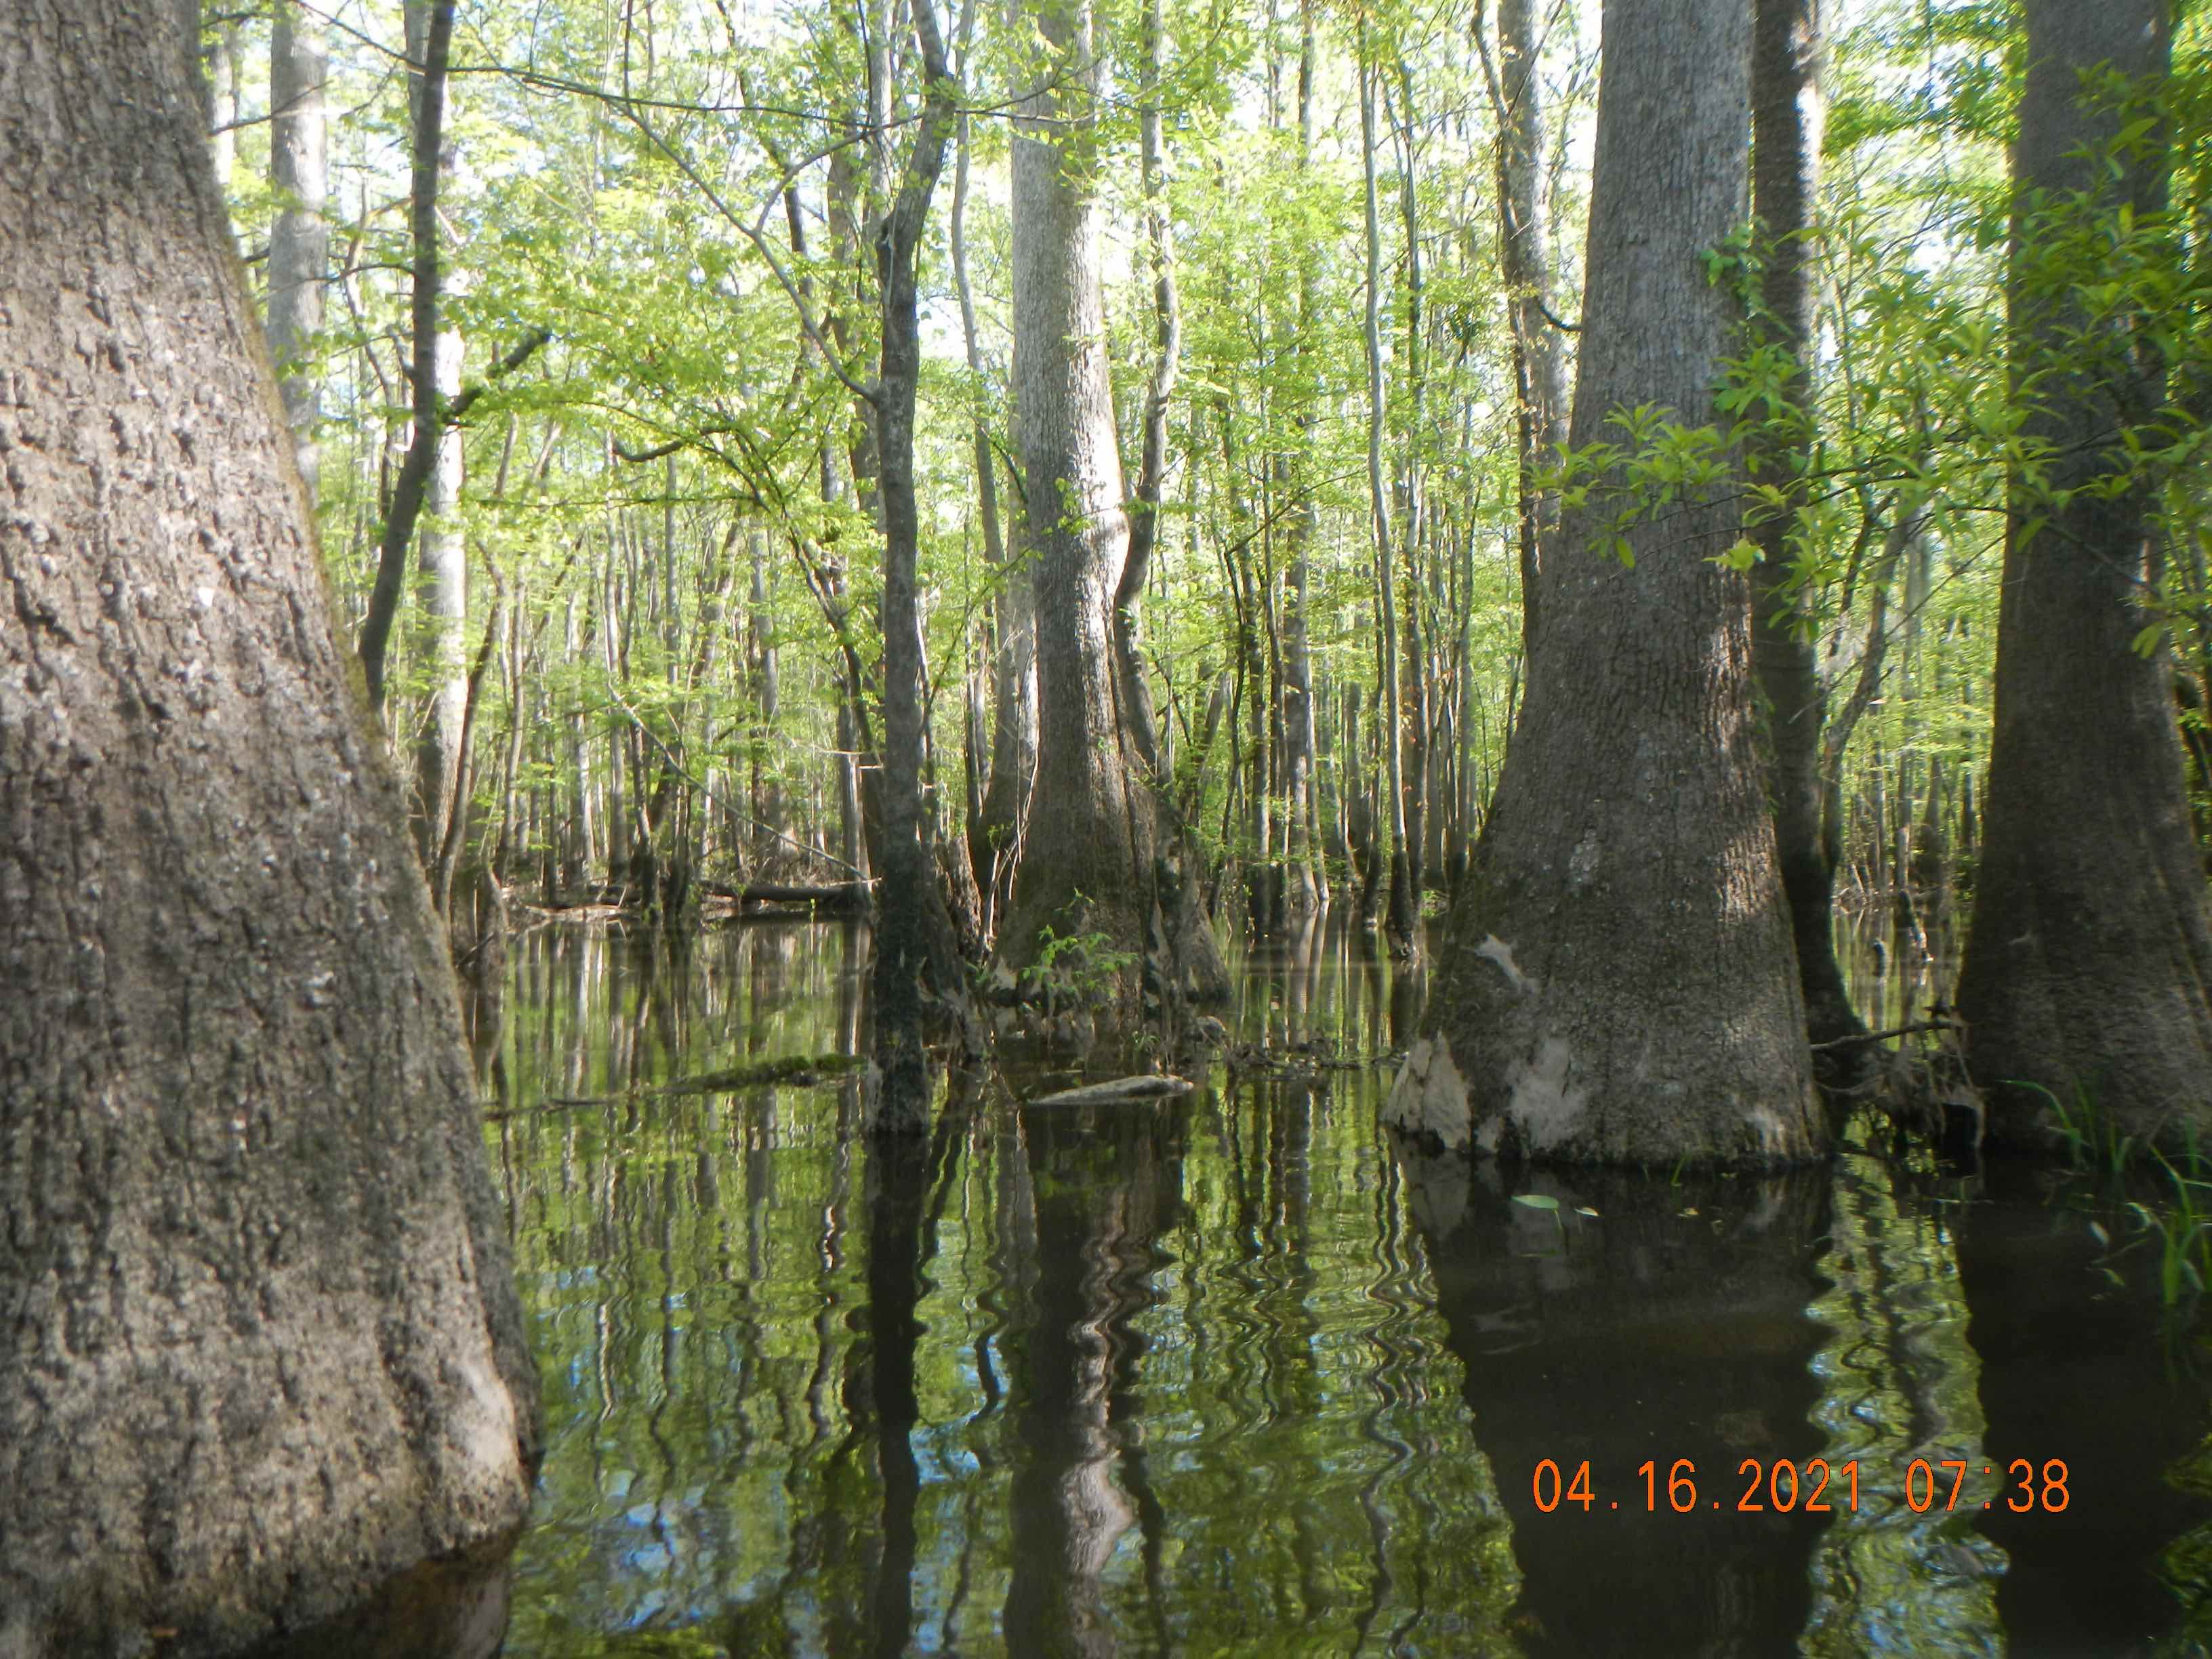
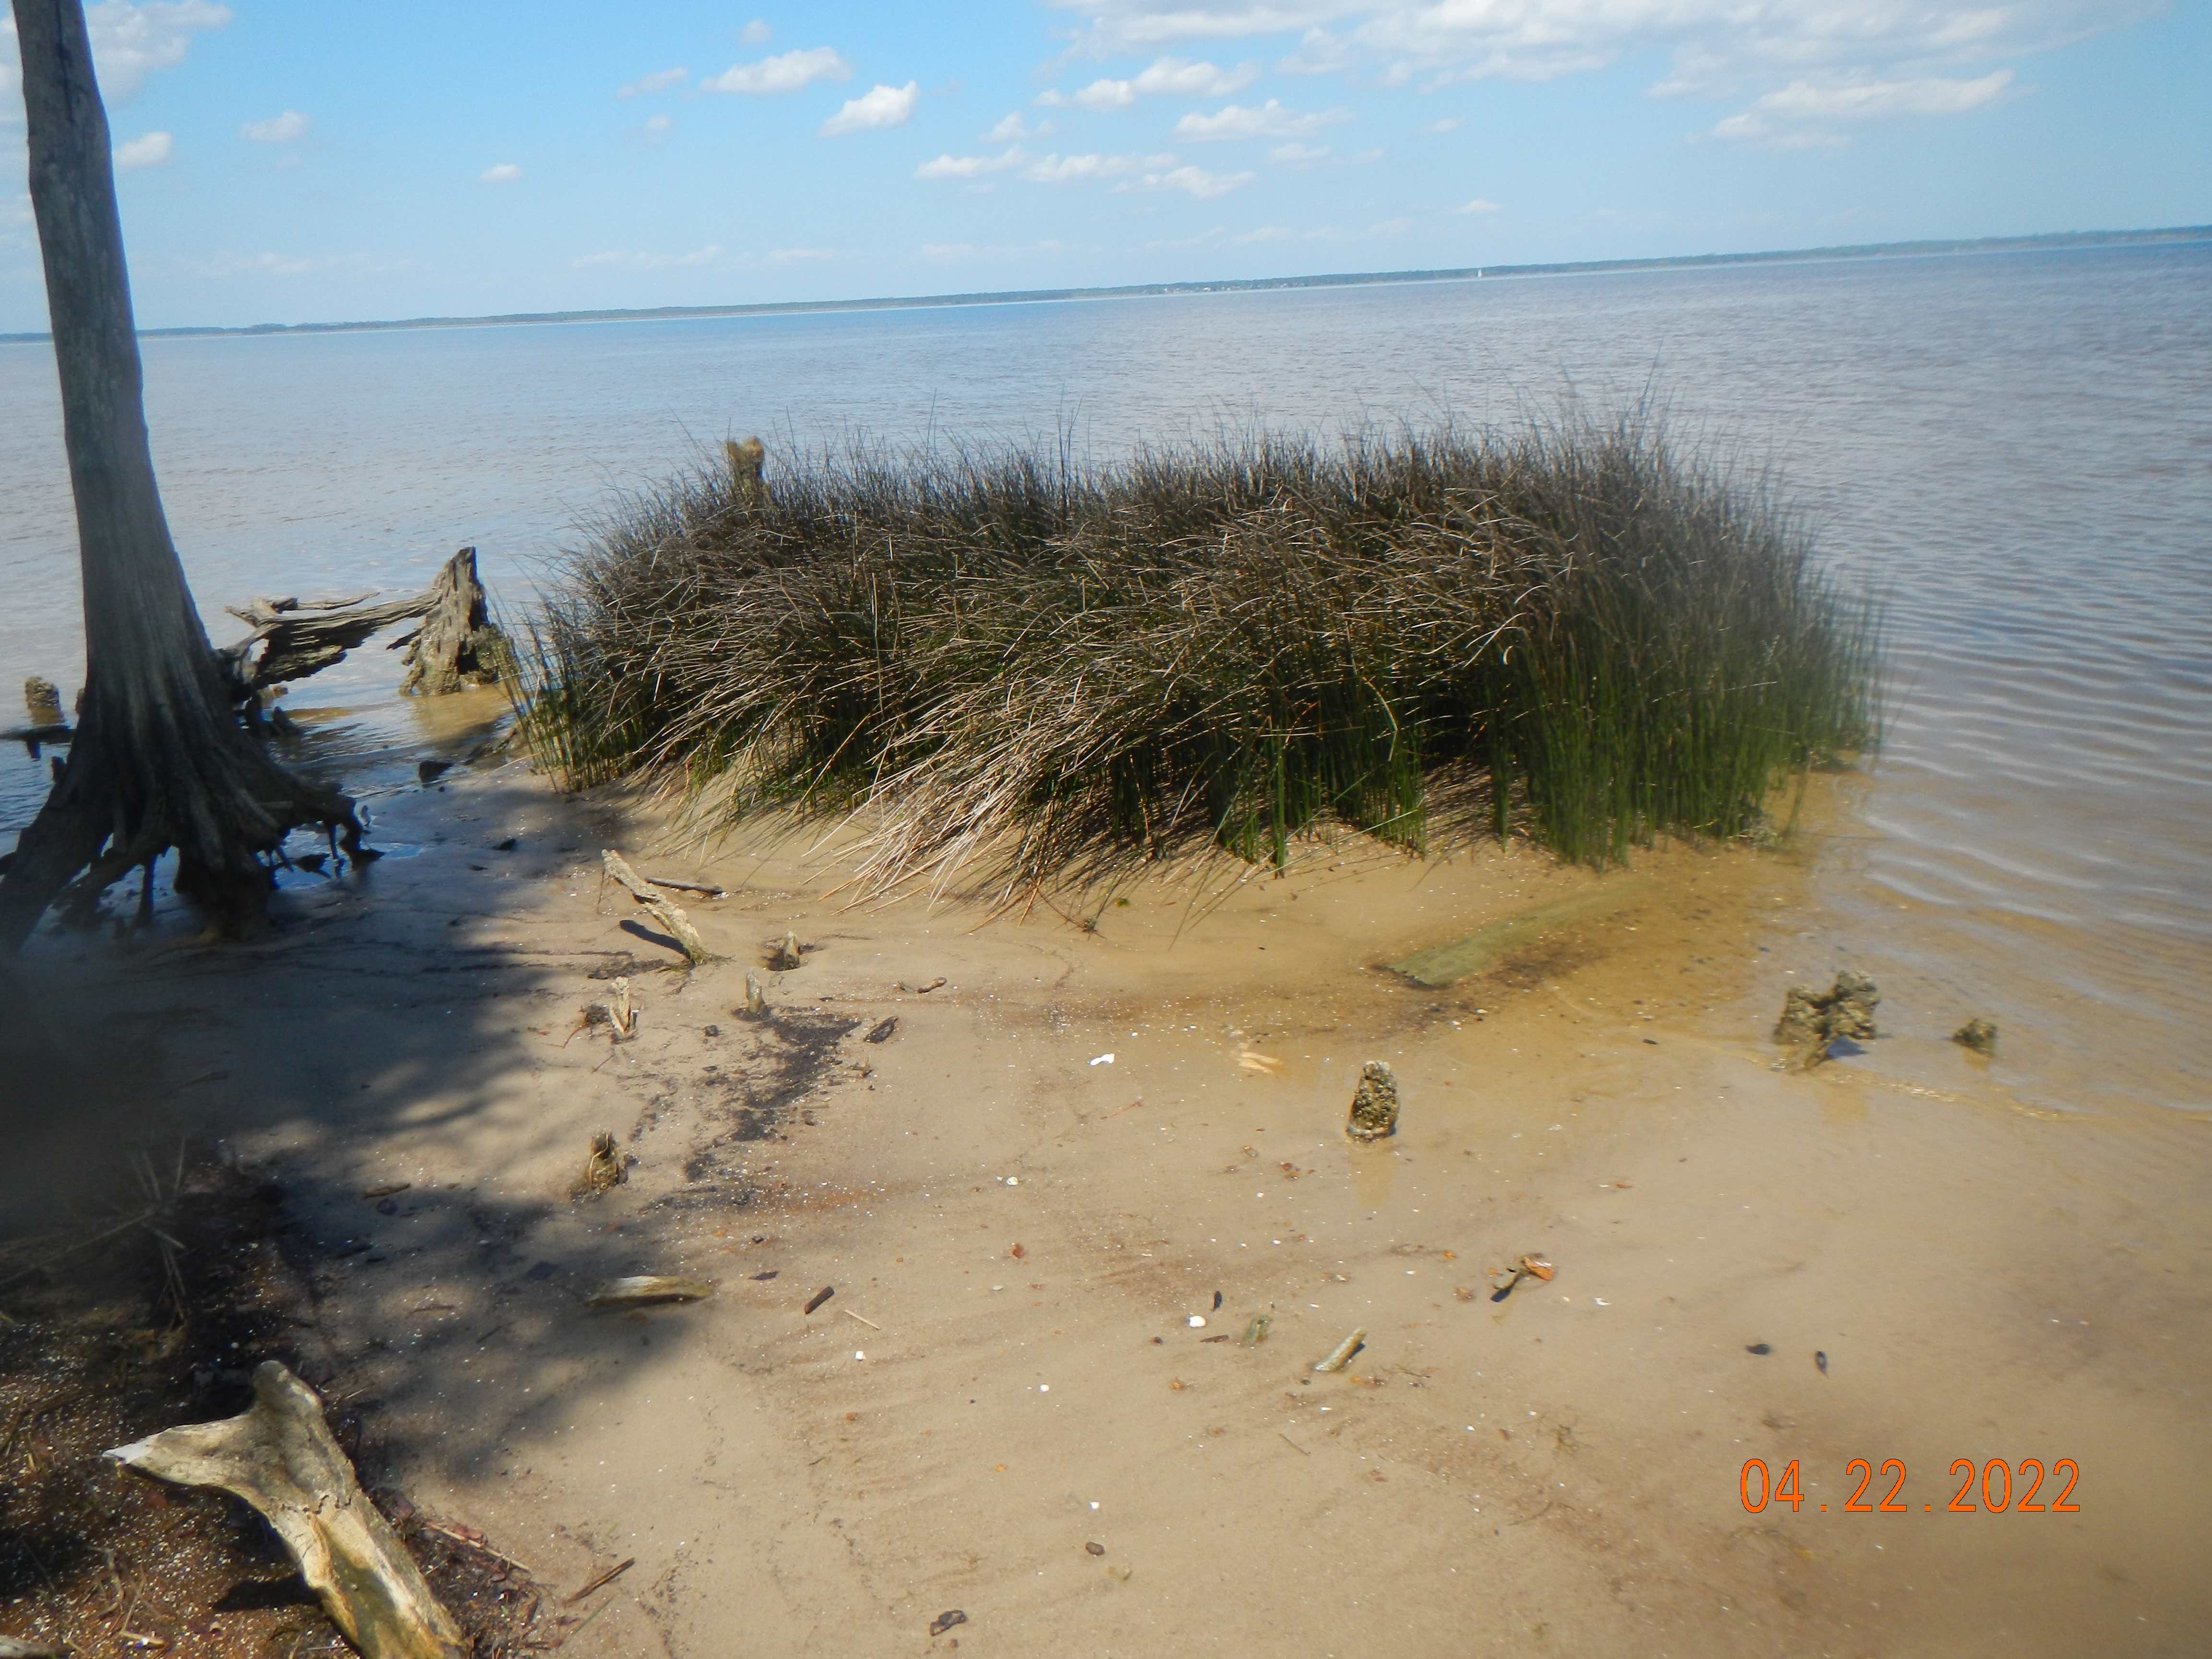
Juncus roemerianus marsh along the North River.

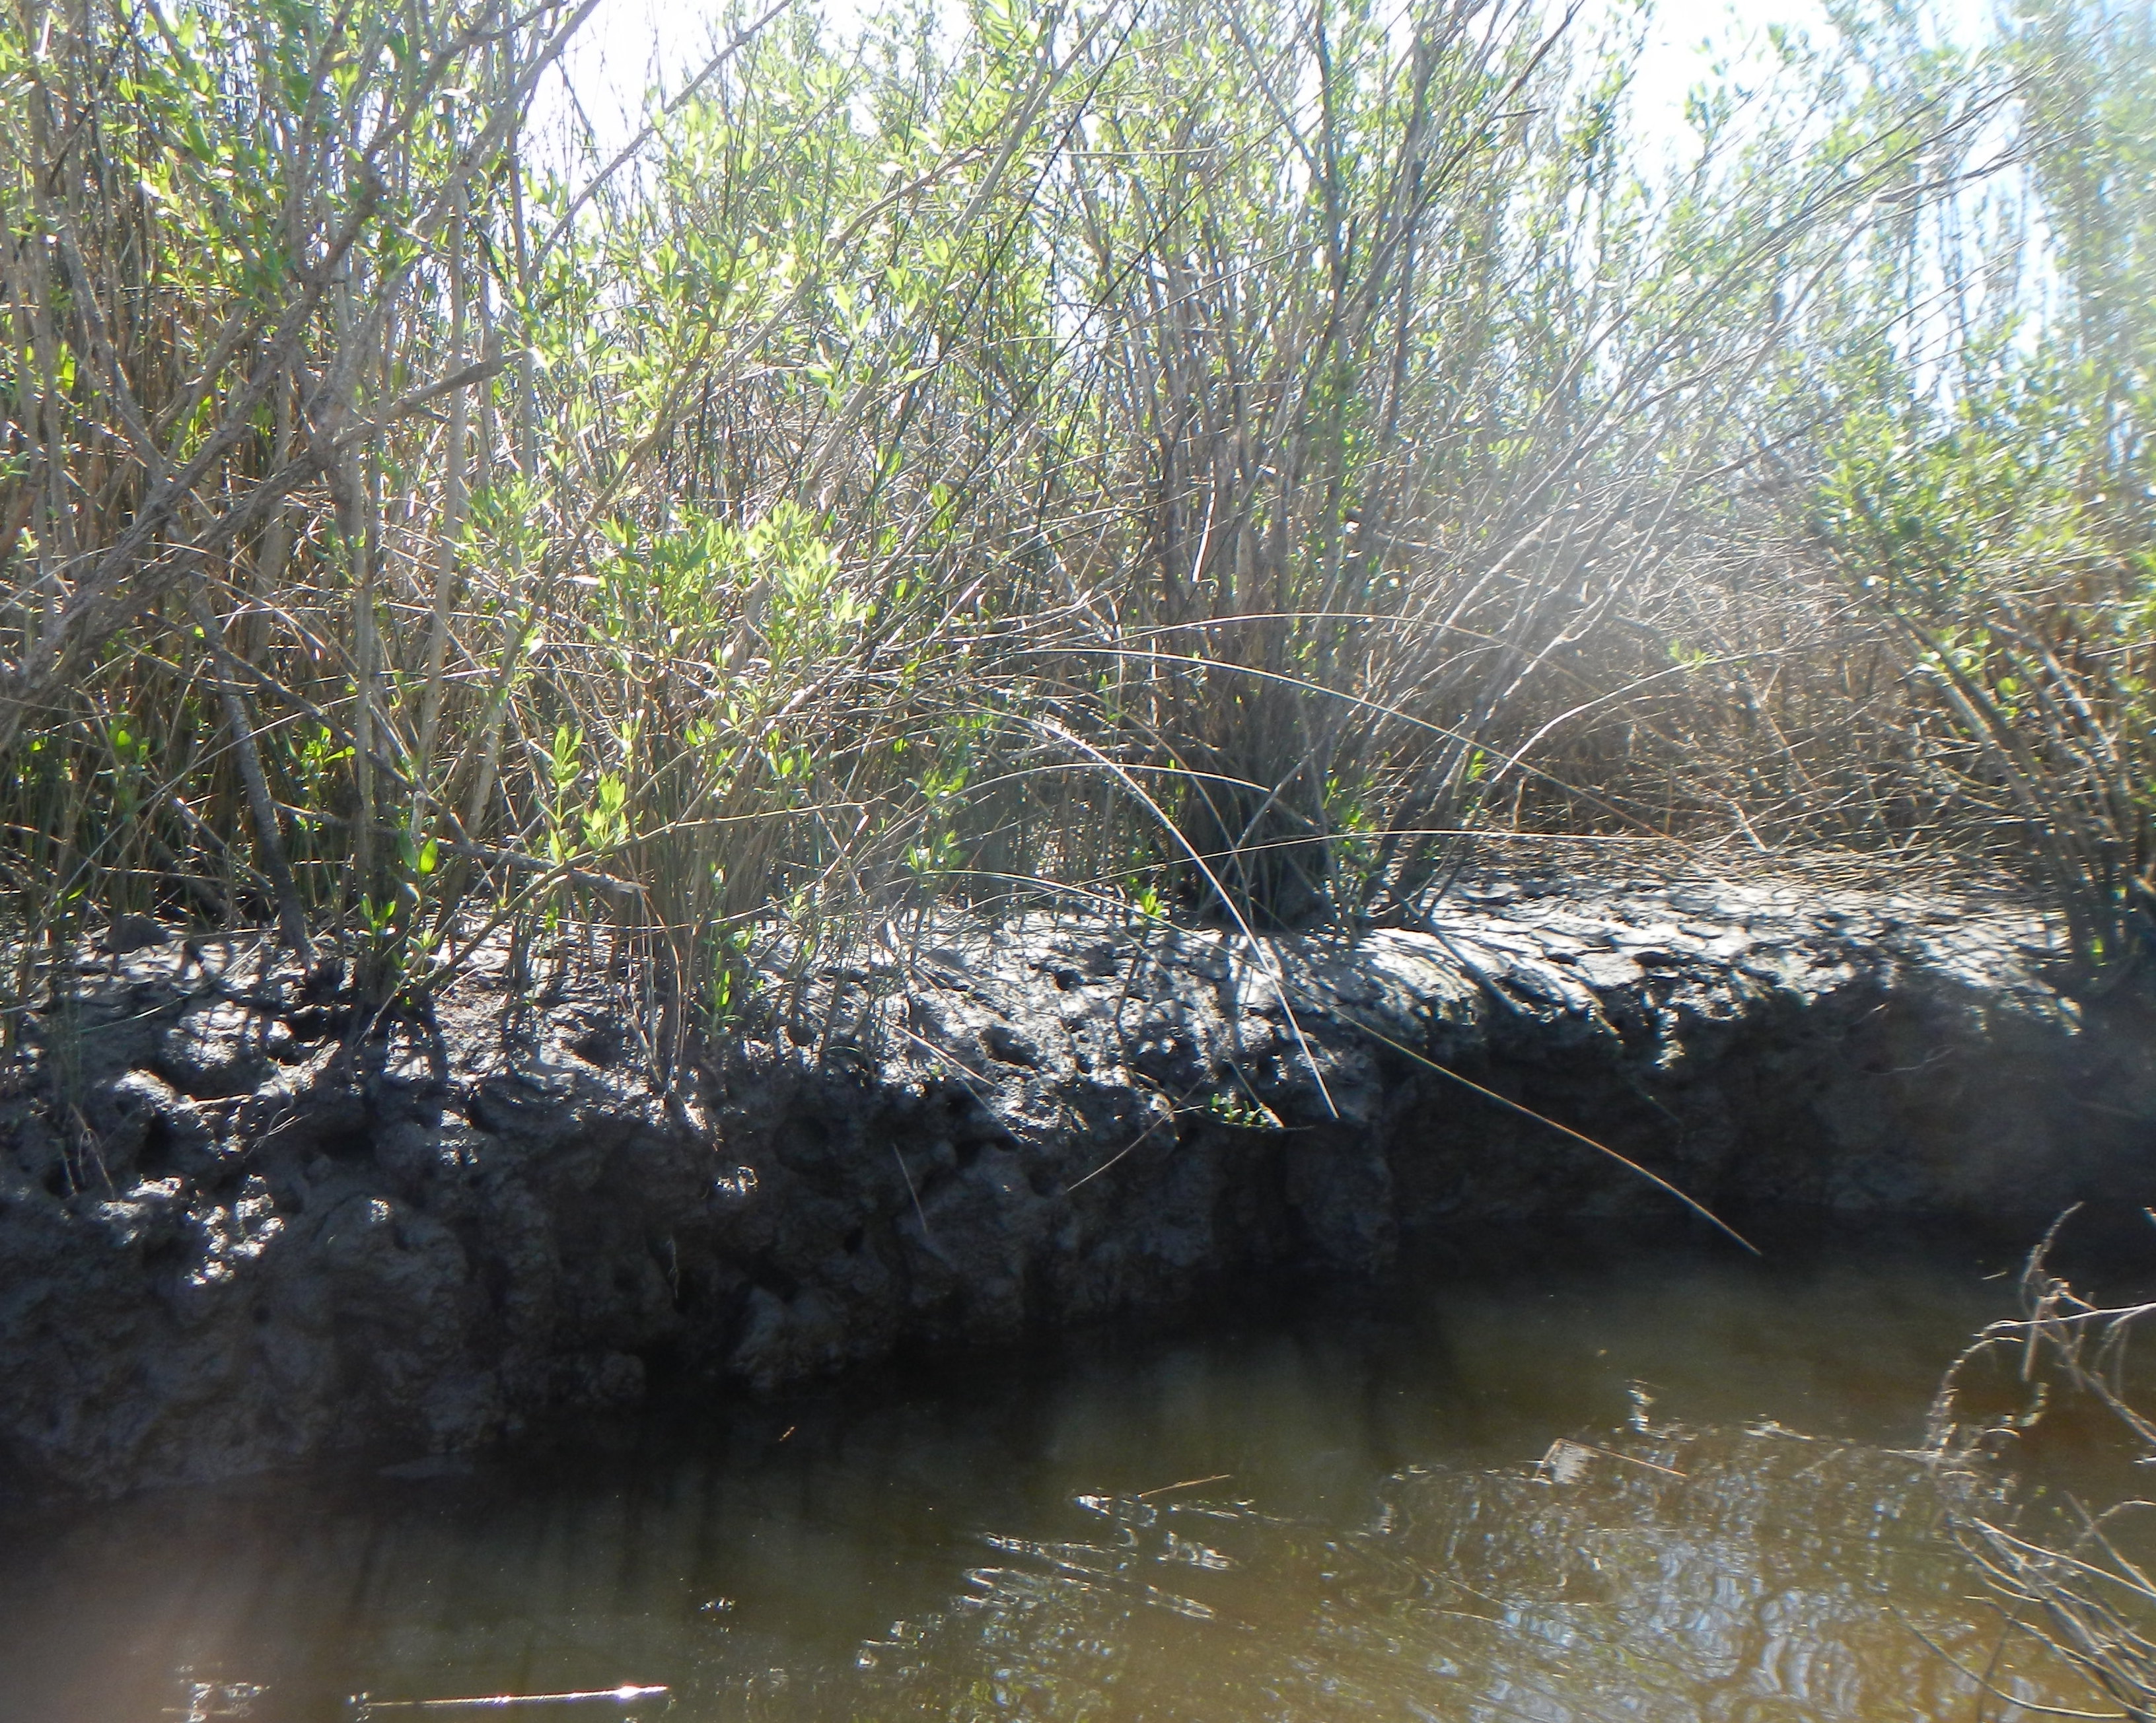
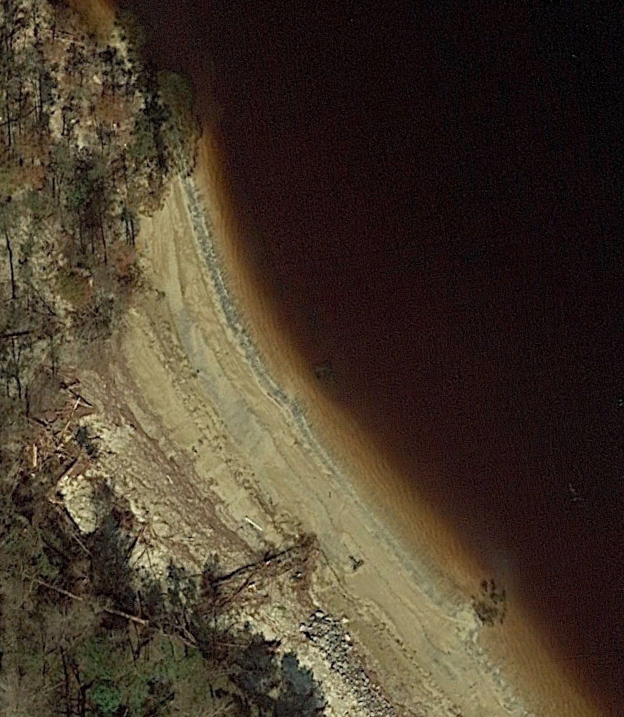
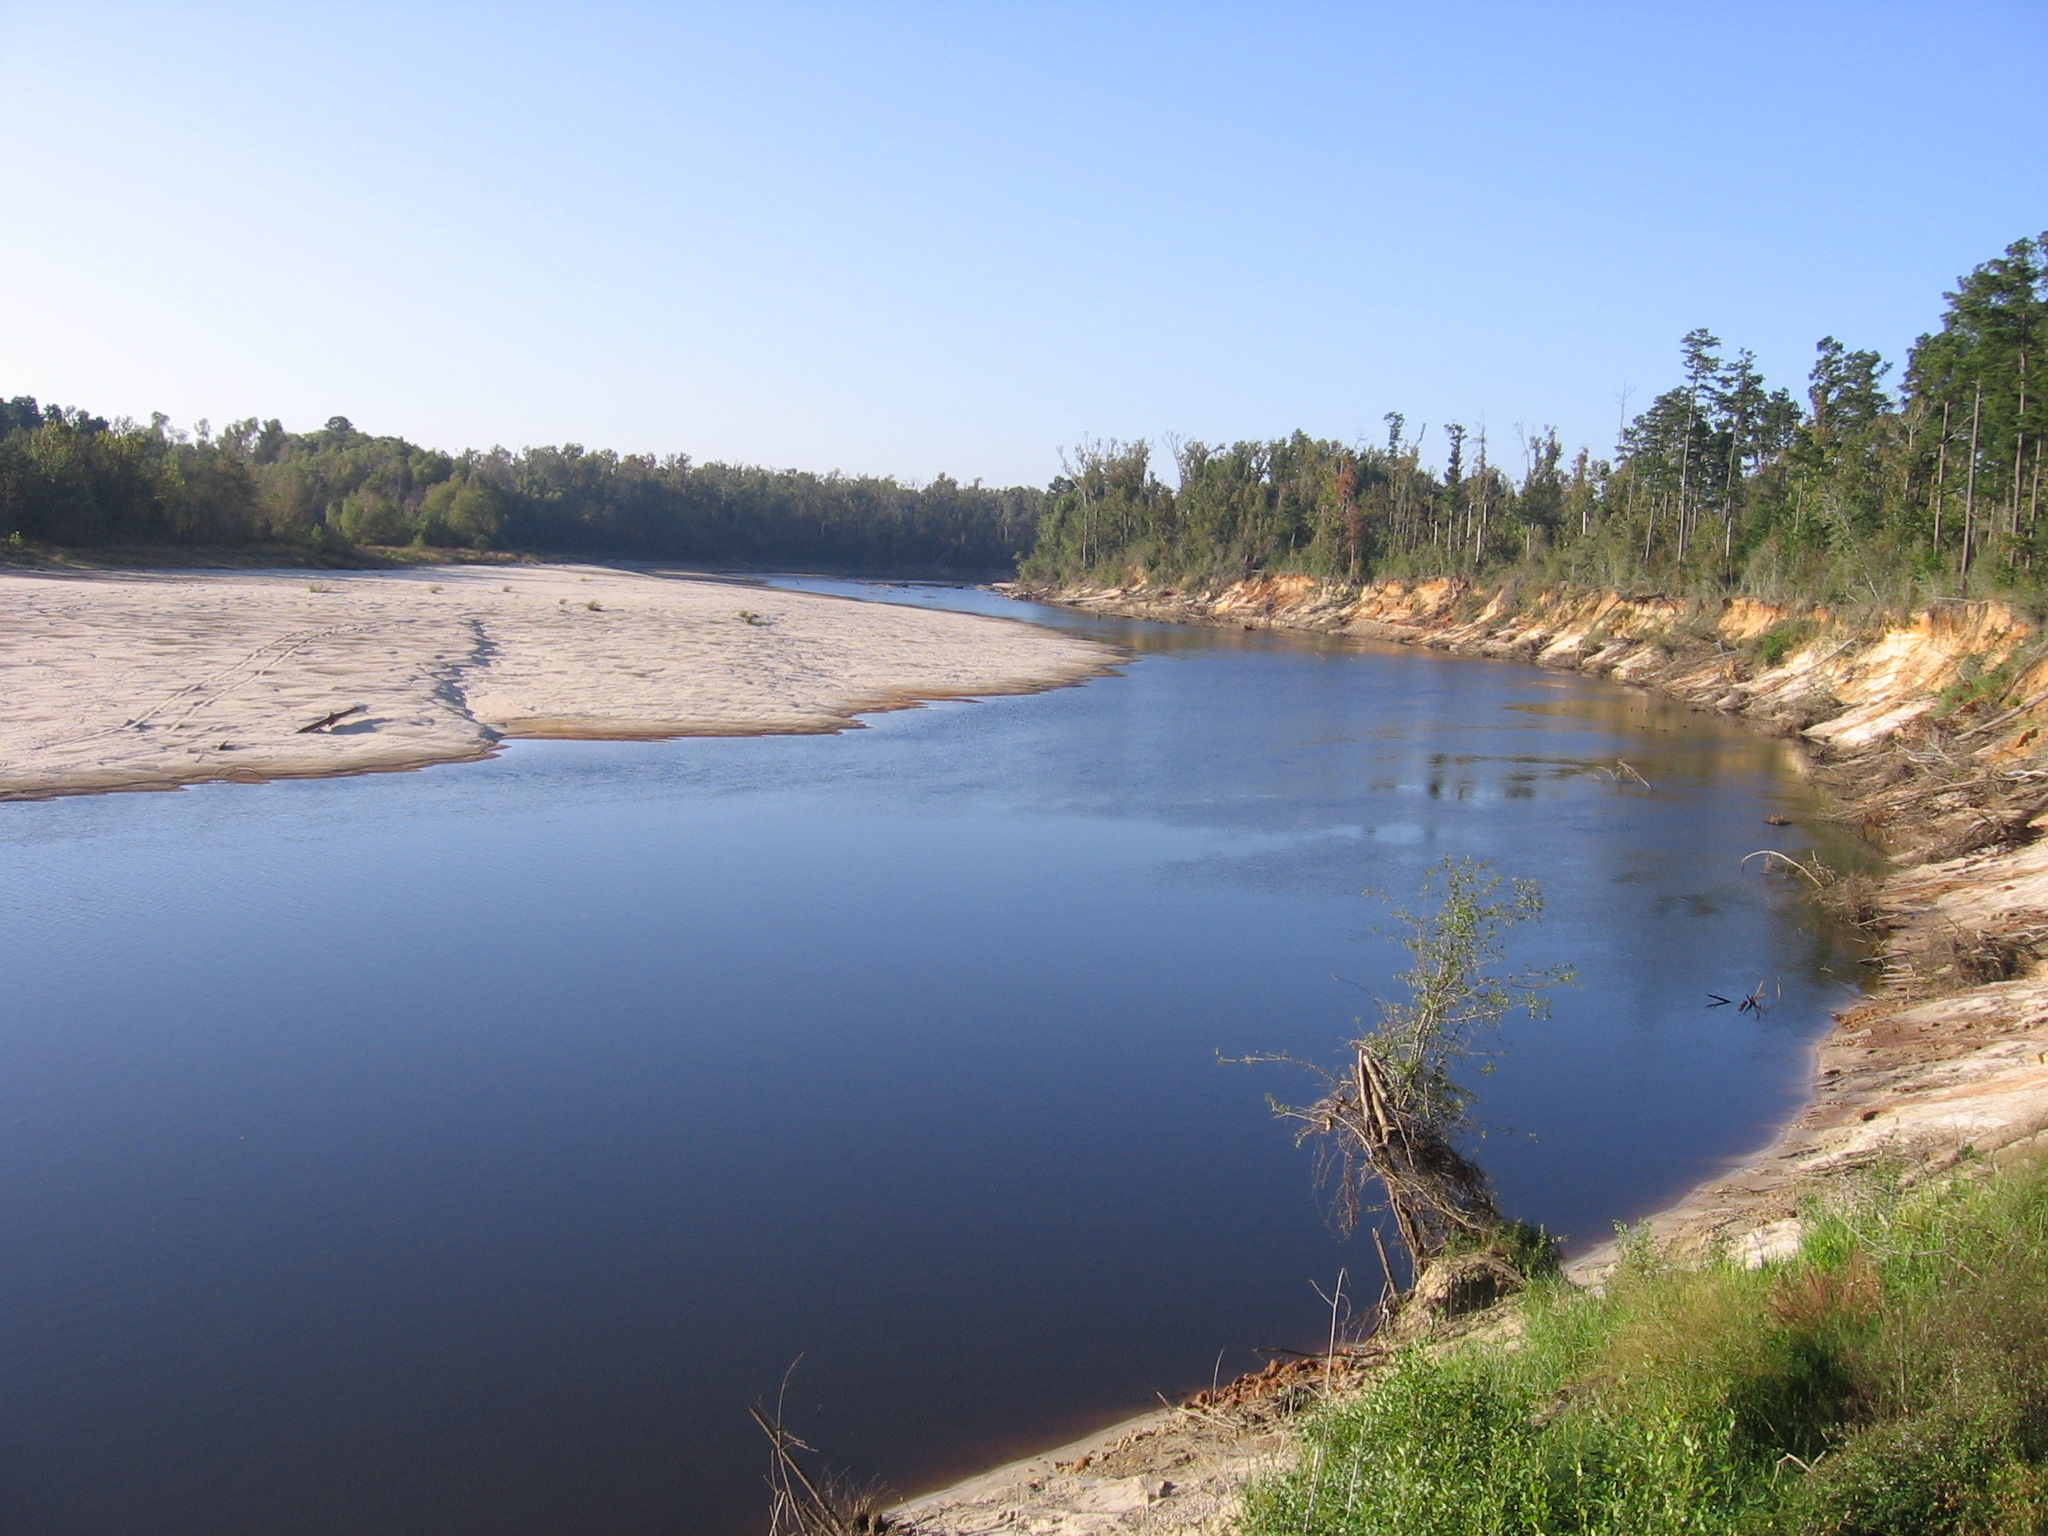
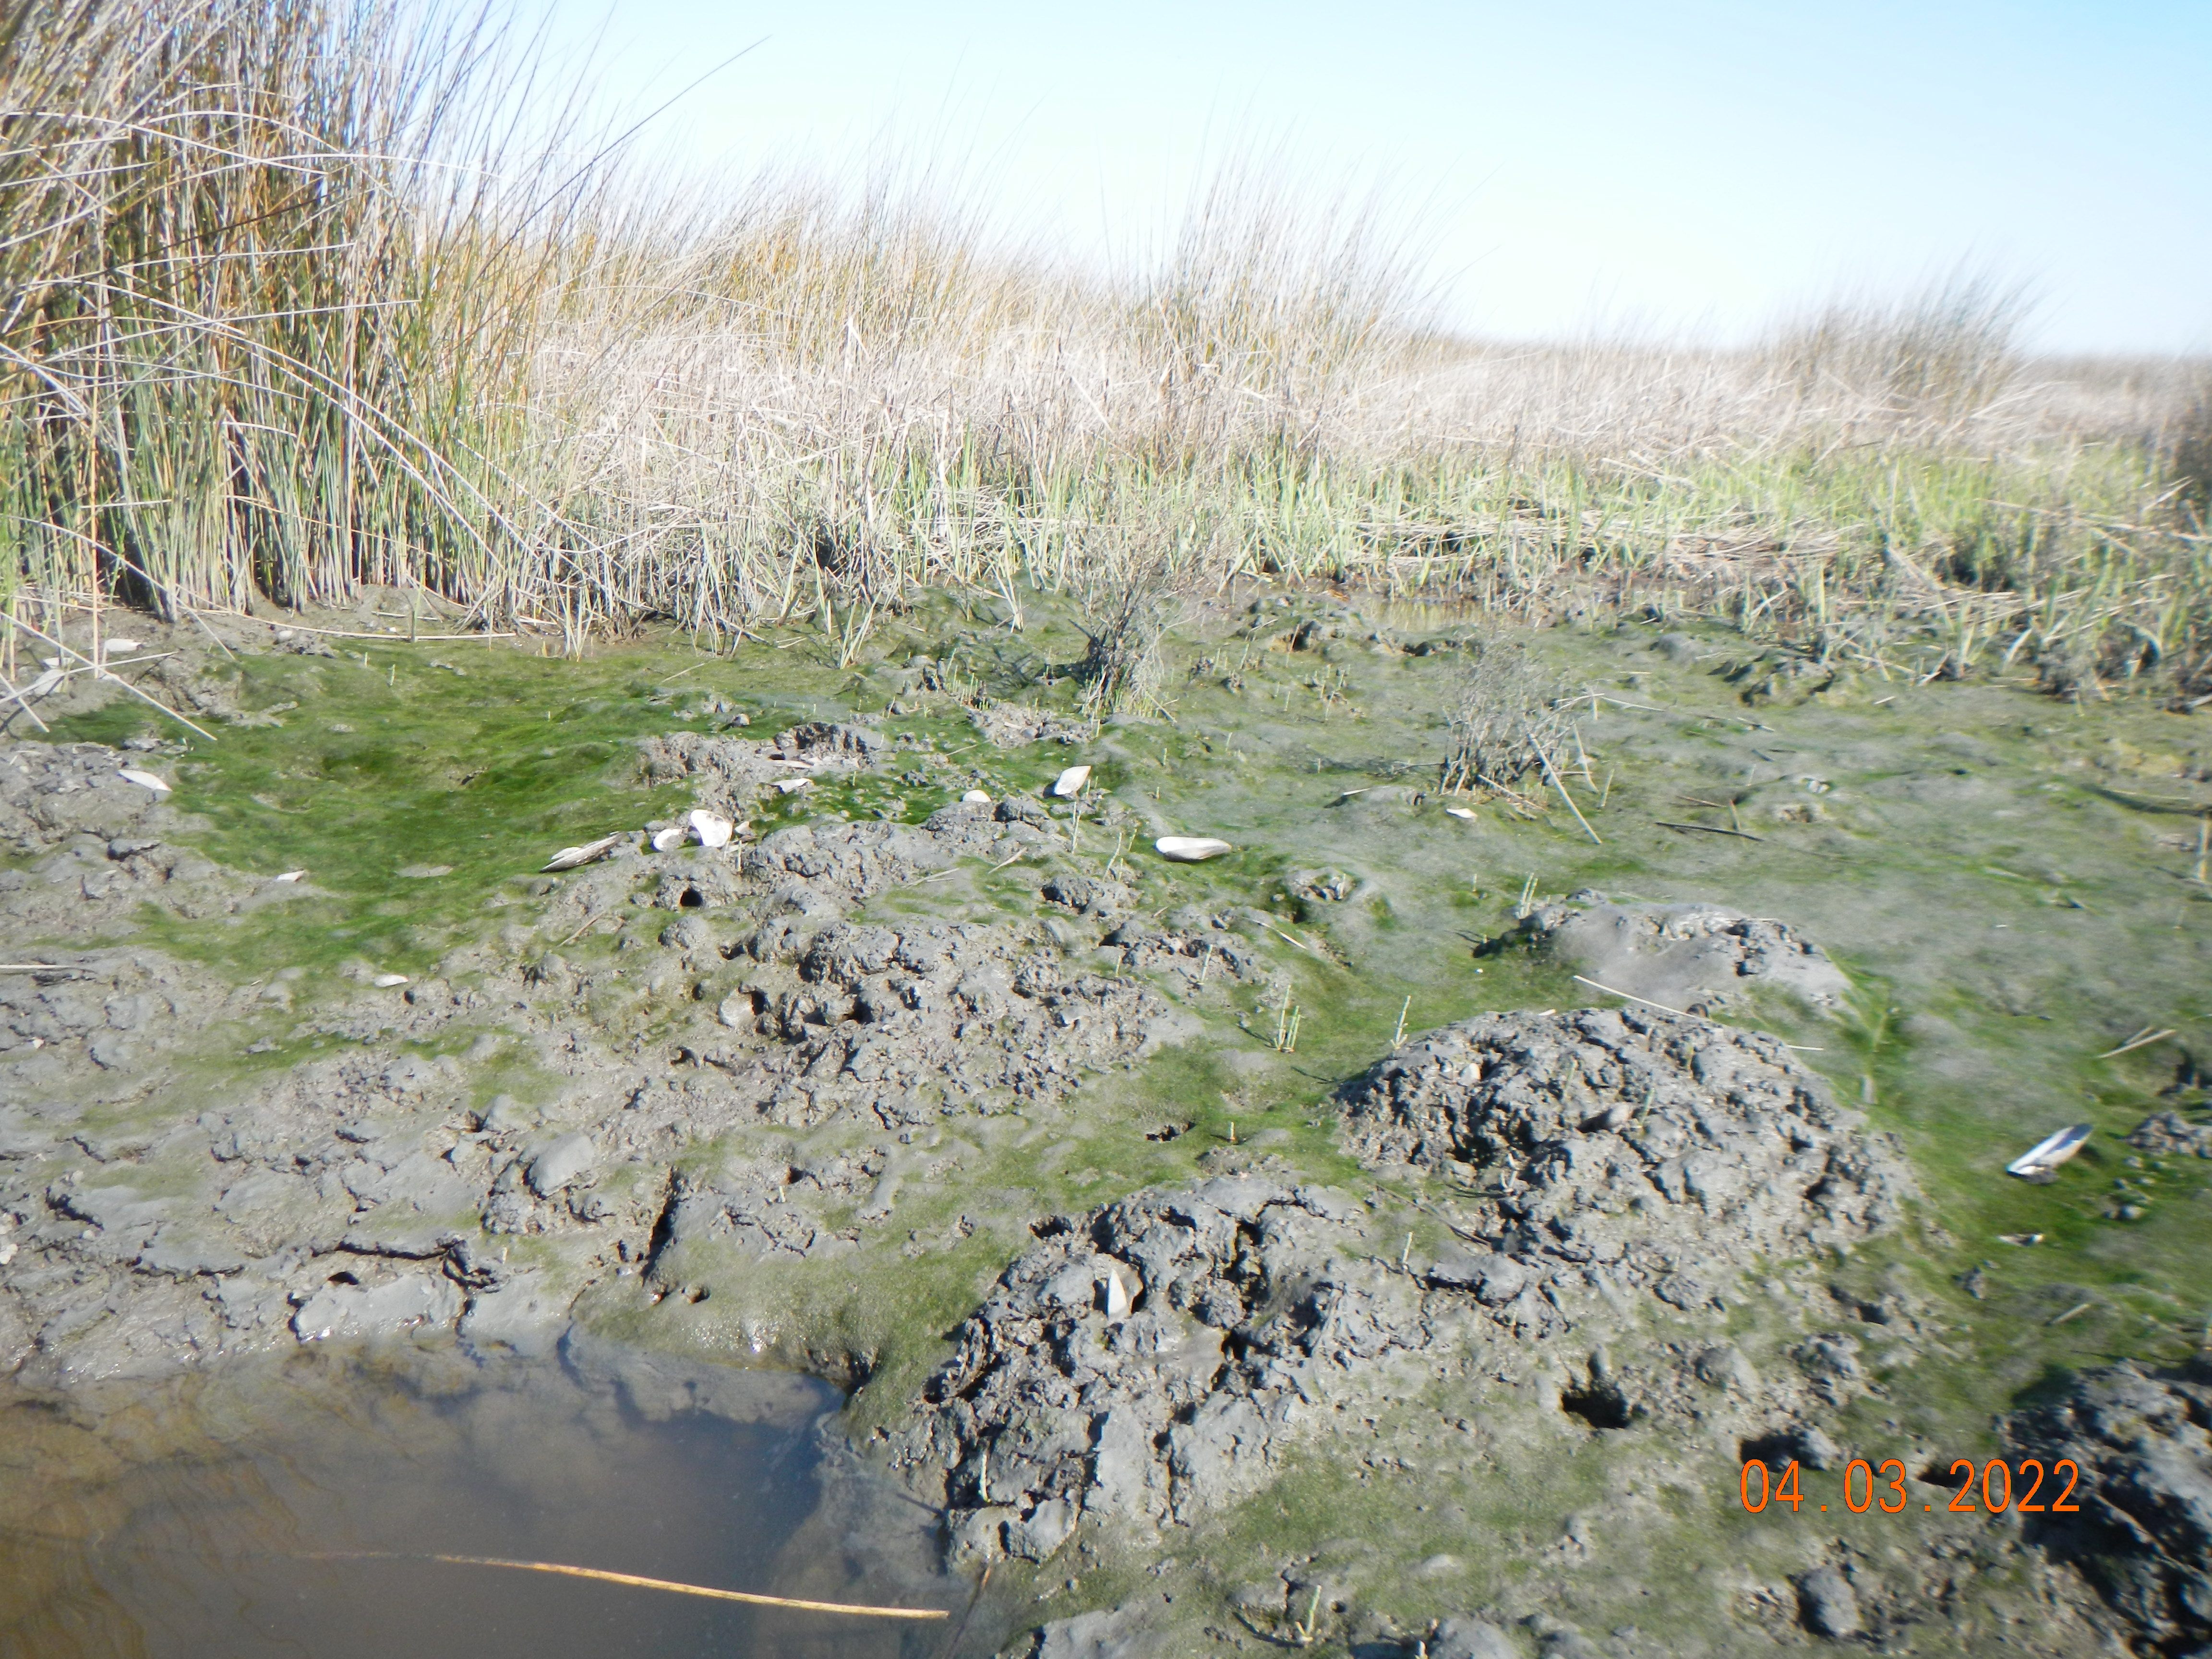
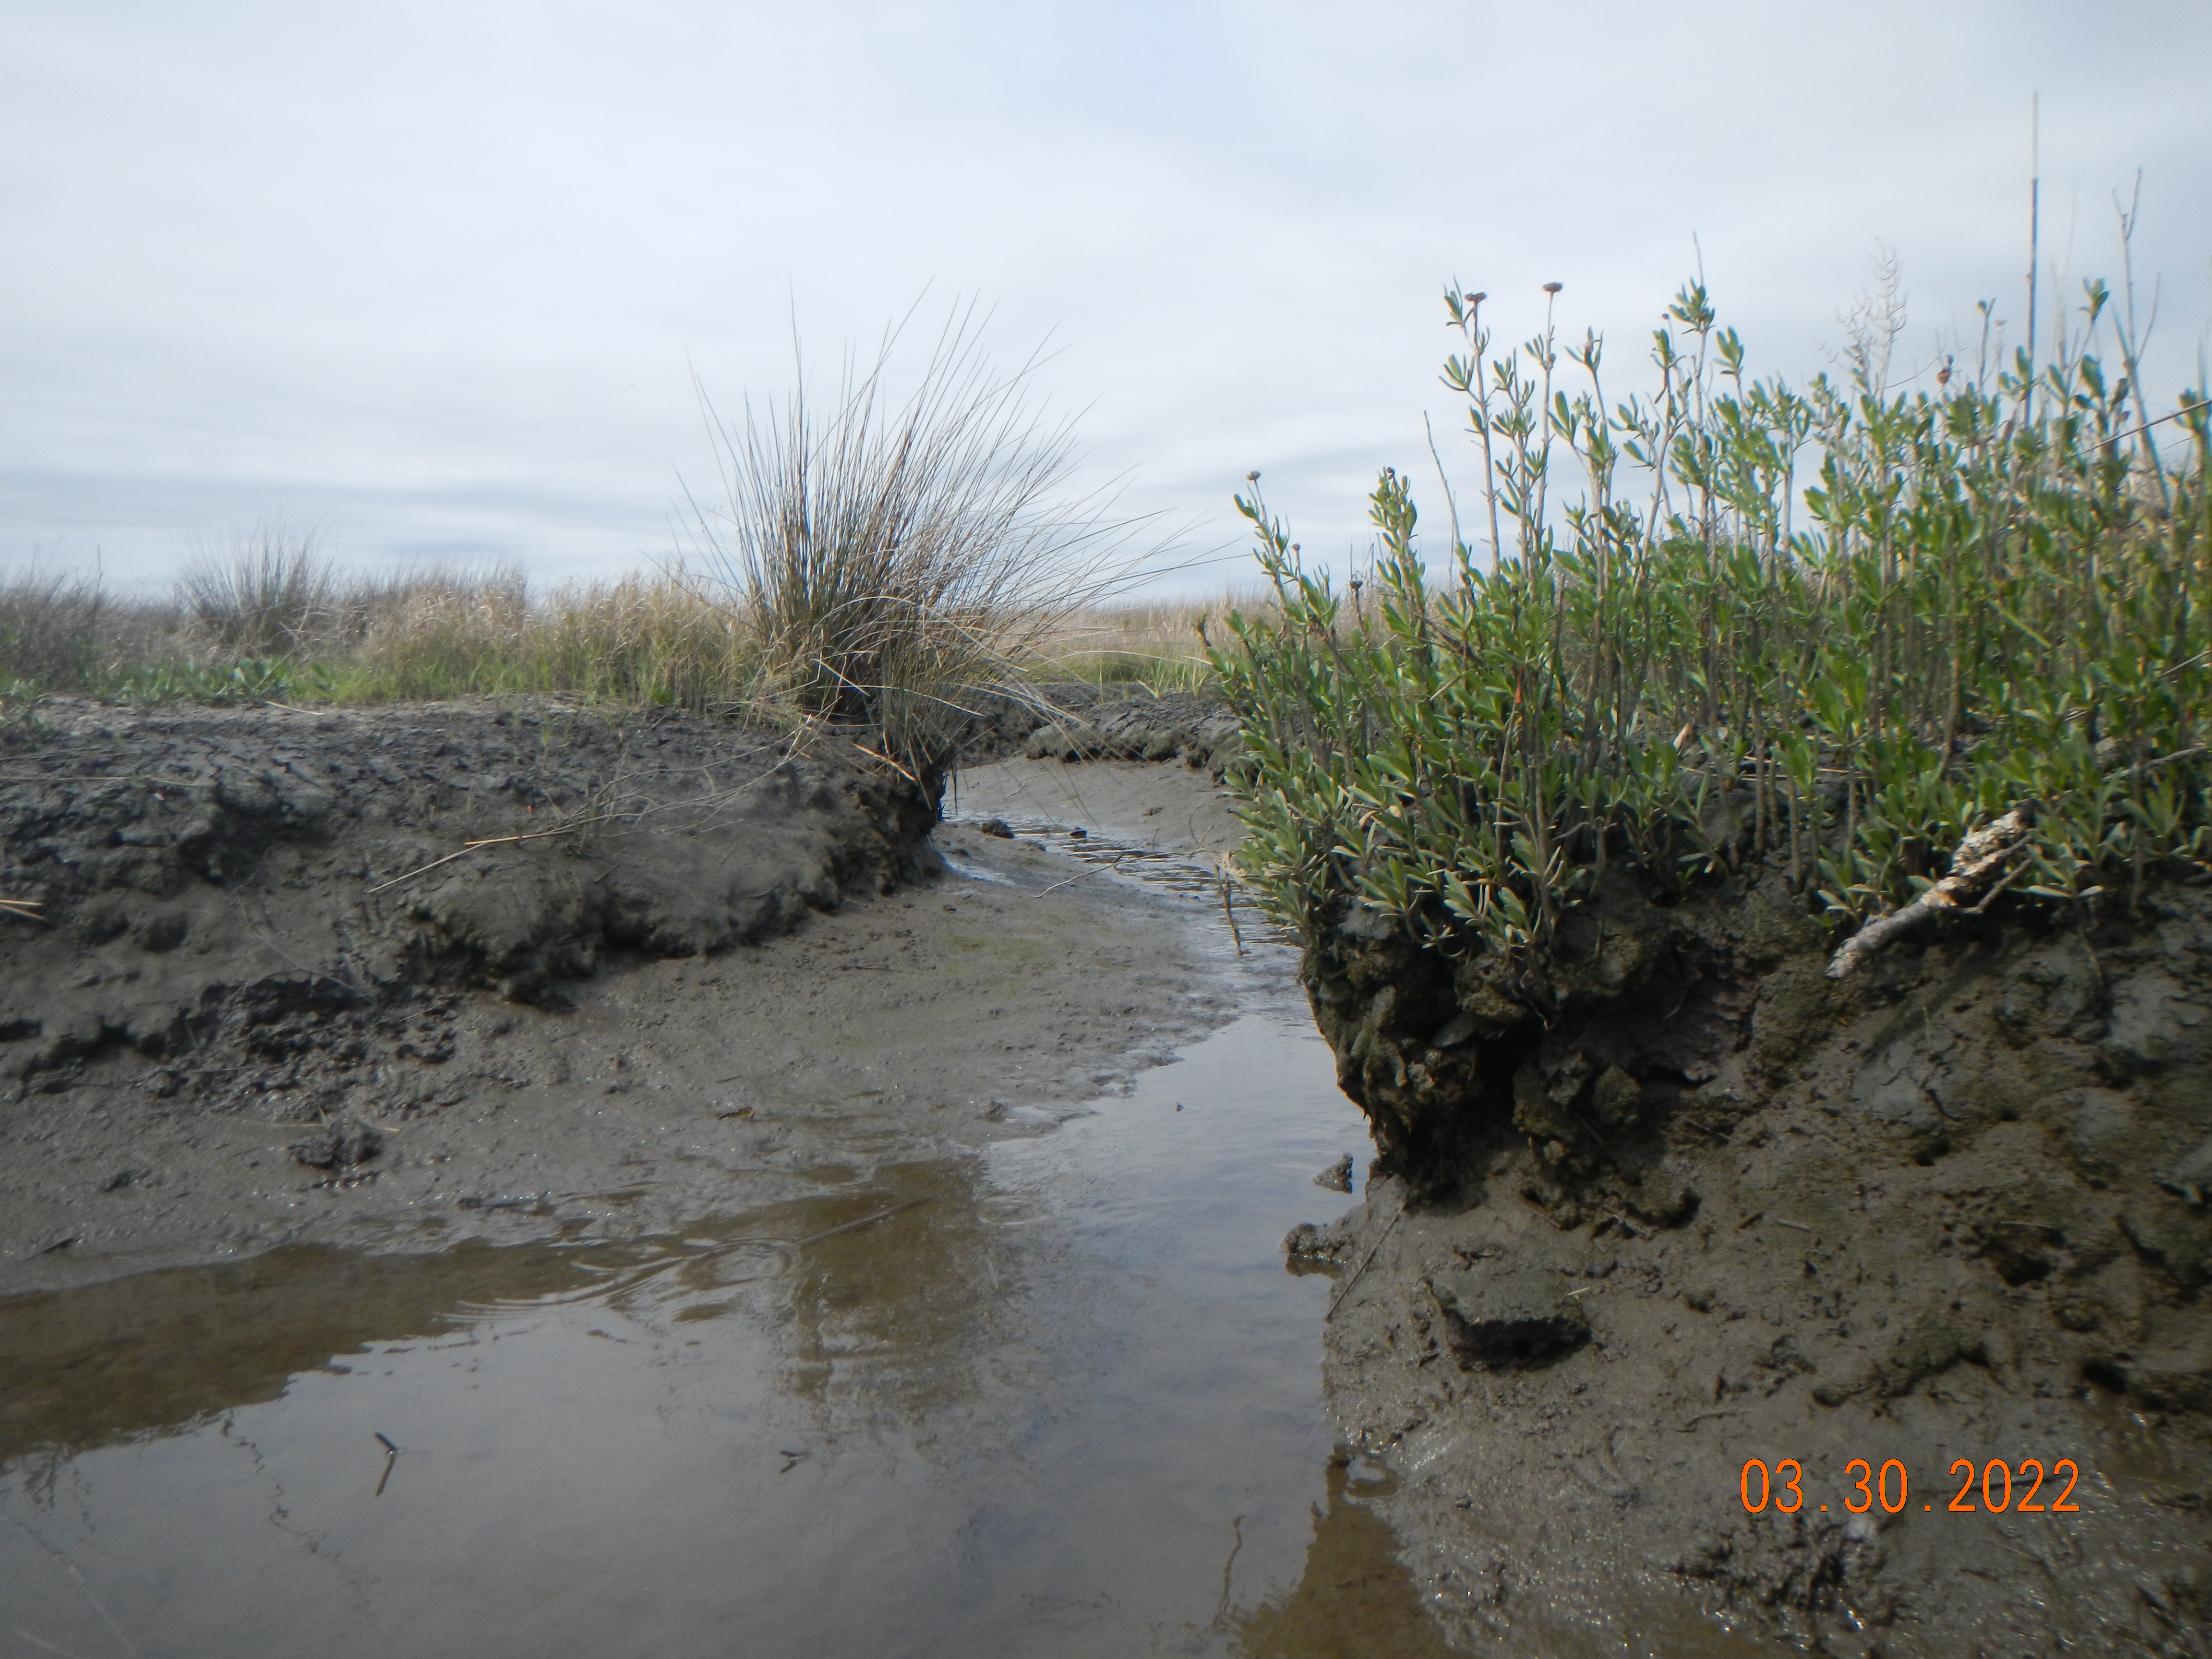
Mud deposits and scarped bank.

Potential sediment sources

First, we’ll identify all conceivable sediment sources, and evaluate them one-by-one. 

1. Fluvial delivery from inner coastal plain or piedmont? Nope. North River has a limited drainage area, entirely within the outer coastal plain, and no connection to larger rivers. 

2. Fluvial delivery from local sources. Possible. Portions of the watershed are developed for agriculture, forestry, and residential use. In the upper river (upstream of Felton Creek) the only potential source is Open Grounds Farm, a large corporate farm established in 1974, with an area of nearly 18,000 ha of mainly row crops. The farm is entirely artificially drained, and the drainage ditches connect to a constructed channel that bypasses the upper North River, though some connection during wet conditions is possible. Most of the farm is mapped as the Deloss soil series, which ranges from sandy clay loam to loamy sand in texture, which seems an unlikely dominant source for the mucky silty clay comprising the most recent (spring 2022) surface deposits. The soil in the marshes is mapped as the Hobucken series, which has muck and mucky fine sandy loam surface horizons, overlying fine sandy loam, but in the field it is difficult to spot any sign of sand. 
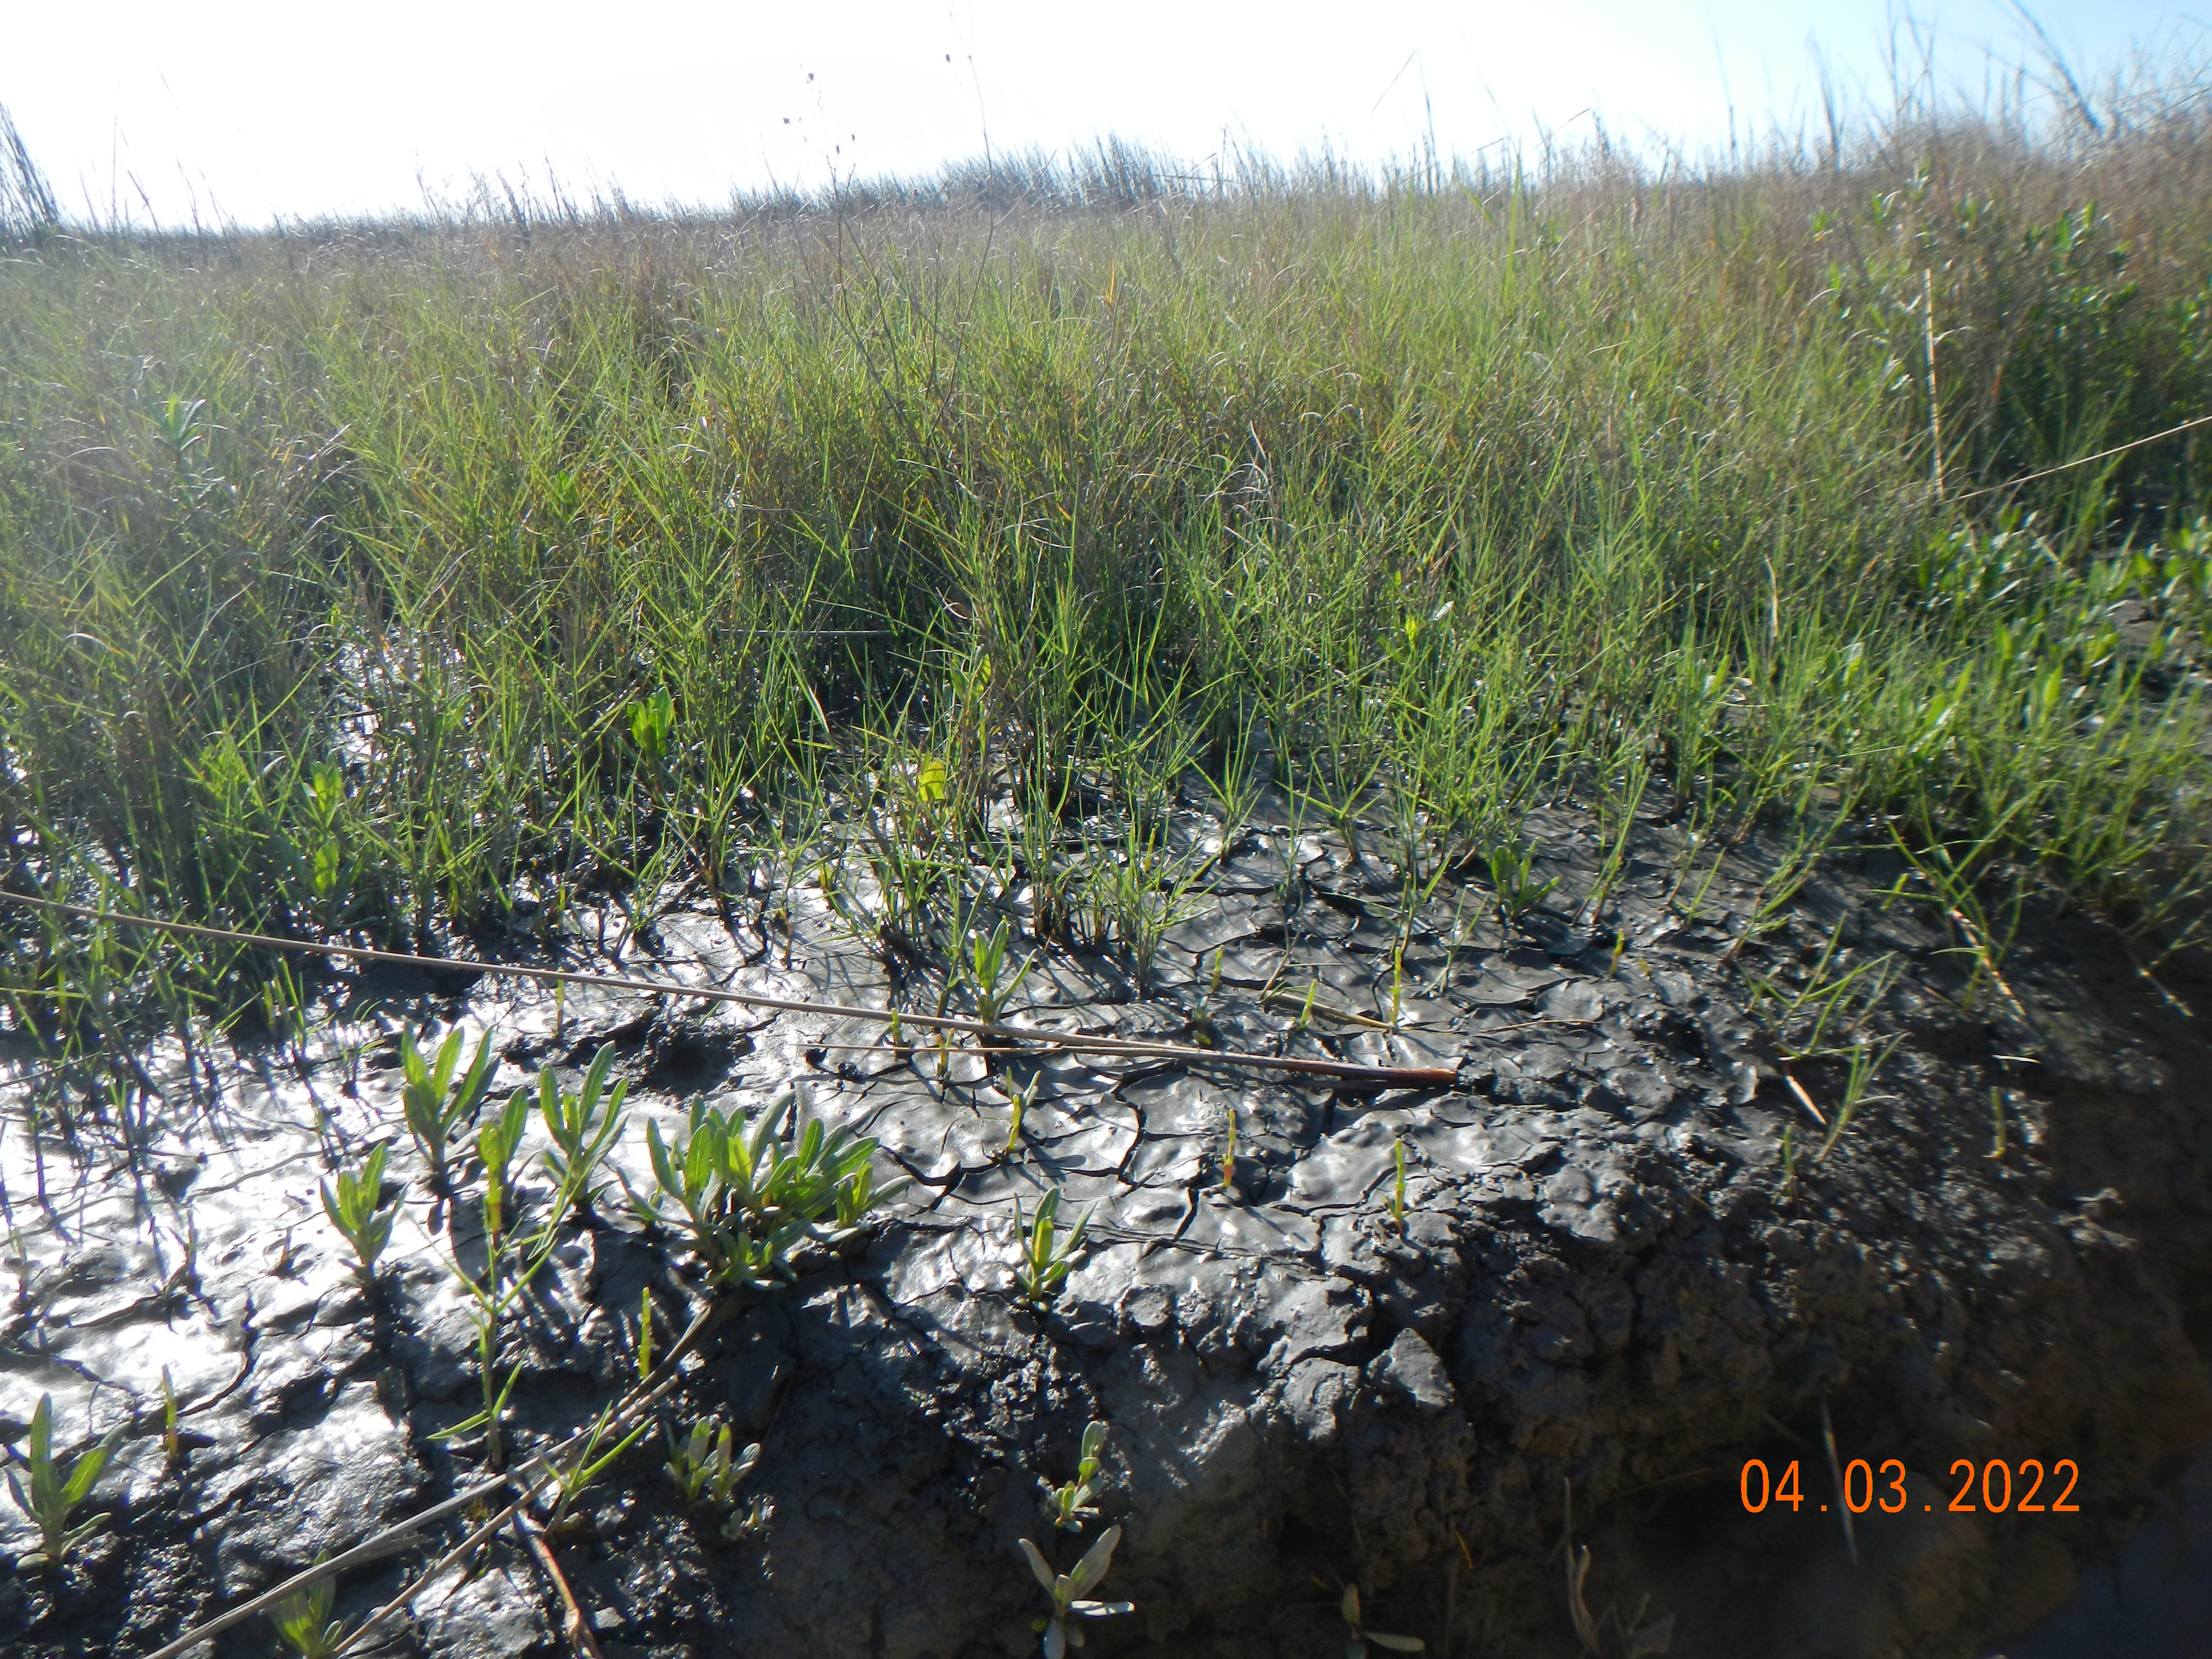
Not much sand here!

I don’t think this is a major source, but I can’t rule it out. First, a lot of my work from back in the day shows that more erosion is occurring on the coastal plain than has traditionally been thought, and that even in larger Piedmont-draining rivers, coastal plain sources are the dominant supply of inorganic sediment in the lower river reaches (see my River Sediment Delivery to the Coast post from December, 2020). Also, in the next-door Newport River estuary, Mattheus et al. (2009) showed that the direct connectivity from tree farming in the upper watershed to the river facilitated a rapid response to erosion and sediment inputs. 

Several case studies, especially from the Chesapeake Bay region, show marshes growing in response to accelerated erosion and sediment production from 18th and 19th century land-clearing, in many cases within small coastal watersheds without much interior drainage area (e.g., Kirwan et al., 2011).

3. Estuarine and marine sediments.  As a tidal system, also strongly influenced by wind, landward or inland transport of estuarine sediments occurs, and also probably offshore sediment as well, as the mouth of the river is close to Beaufort Inlet. 

4. Aeolian input. Inputs of wind-transported sediment are not usually considered significant, except in marshes on the back side of barrier islands or otherwise in proximity to sand dunes. However, studies of dust inputs to soils in many locations have typically found significant aeolian contributions even where wind erosion and aeolian processes are not considered significant. Dust is also the major source of bioavailable iron to the ocean. Charles Darwin (1846) published a paper on dust falling on vessels in the Atlantic Ocean. There is no reason to suspect that the North River and its wetlands do not also get some dust input. Further, studies on the N.C. coastal plain have found significant aeolian erosion from croplands (Pease et al., 2002; Gares et al., 2006). Thus wind-blown sediment from Open Grounds and several other nearby corporate farms is possible, as well as dust from father afield. 

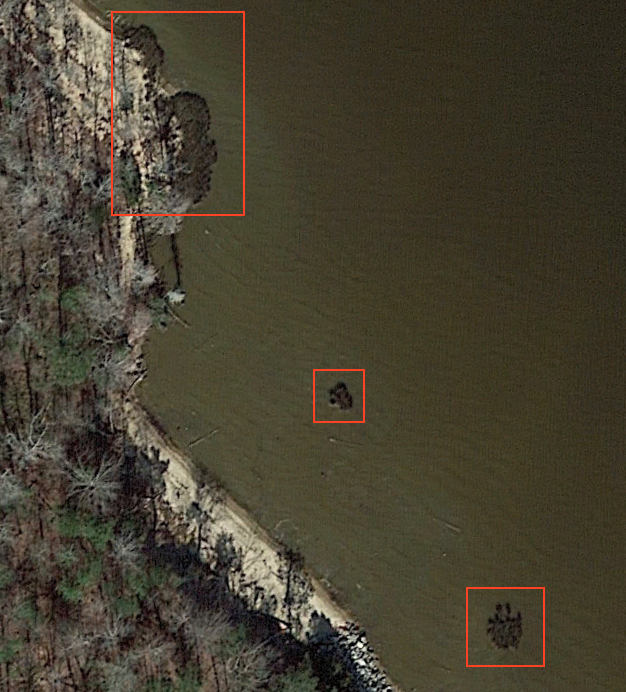
5. Marsh bank erosion. The area includes numerous scarped marsh edges and tidal creek banks, and slumps from recently eroded material are evident in many locations. This source is essentially a recycling of sediment previously deposited on the marsh. 

No measurements of bank erosion in the North River have been made, but field evidence is abundant and obvious, and studies in other nearby estuaries demonstrated that erosion of marsh (and other shorelines) is a significant sediment source (though the marsh edges tend to erode more slowly, on average, than other shoreline types; Cowart et al., 2010; 2011; Currin et al, 2015). 

Scarped marsh bank, with high tide line clearly shown several cm above marsh surface.

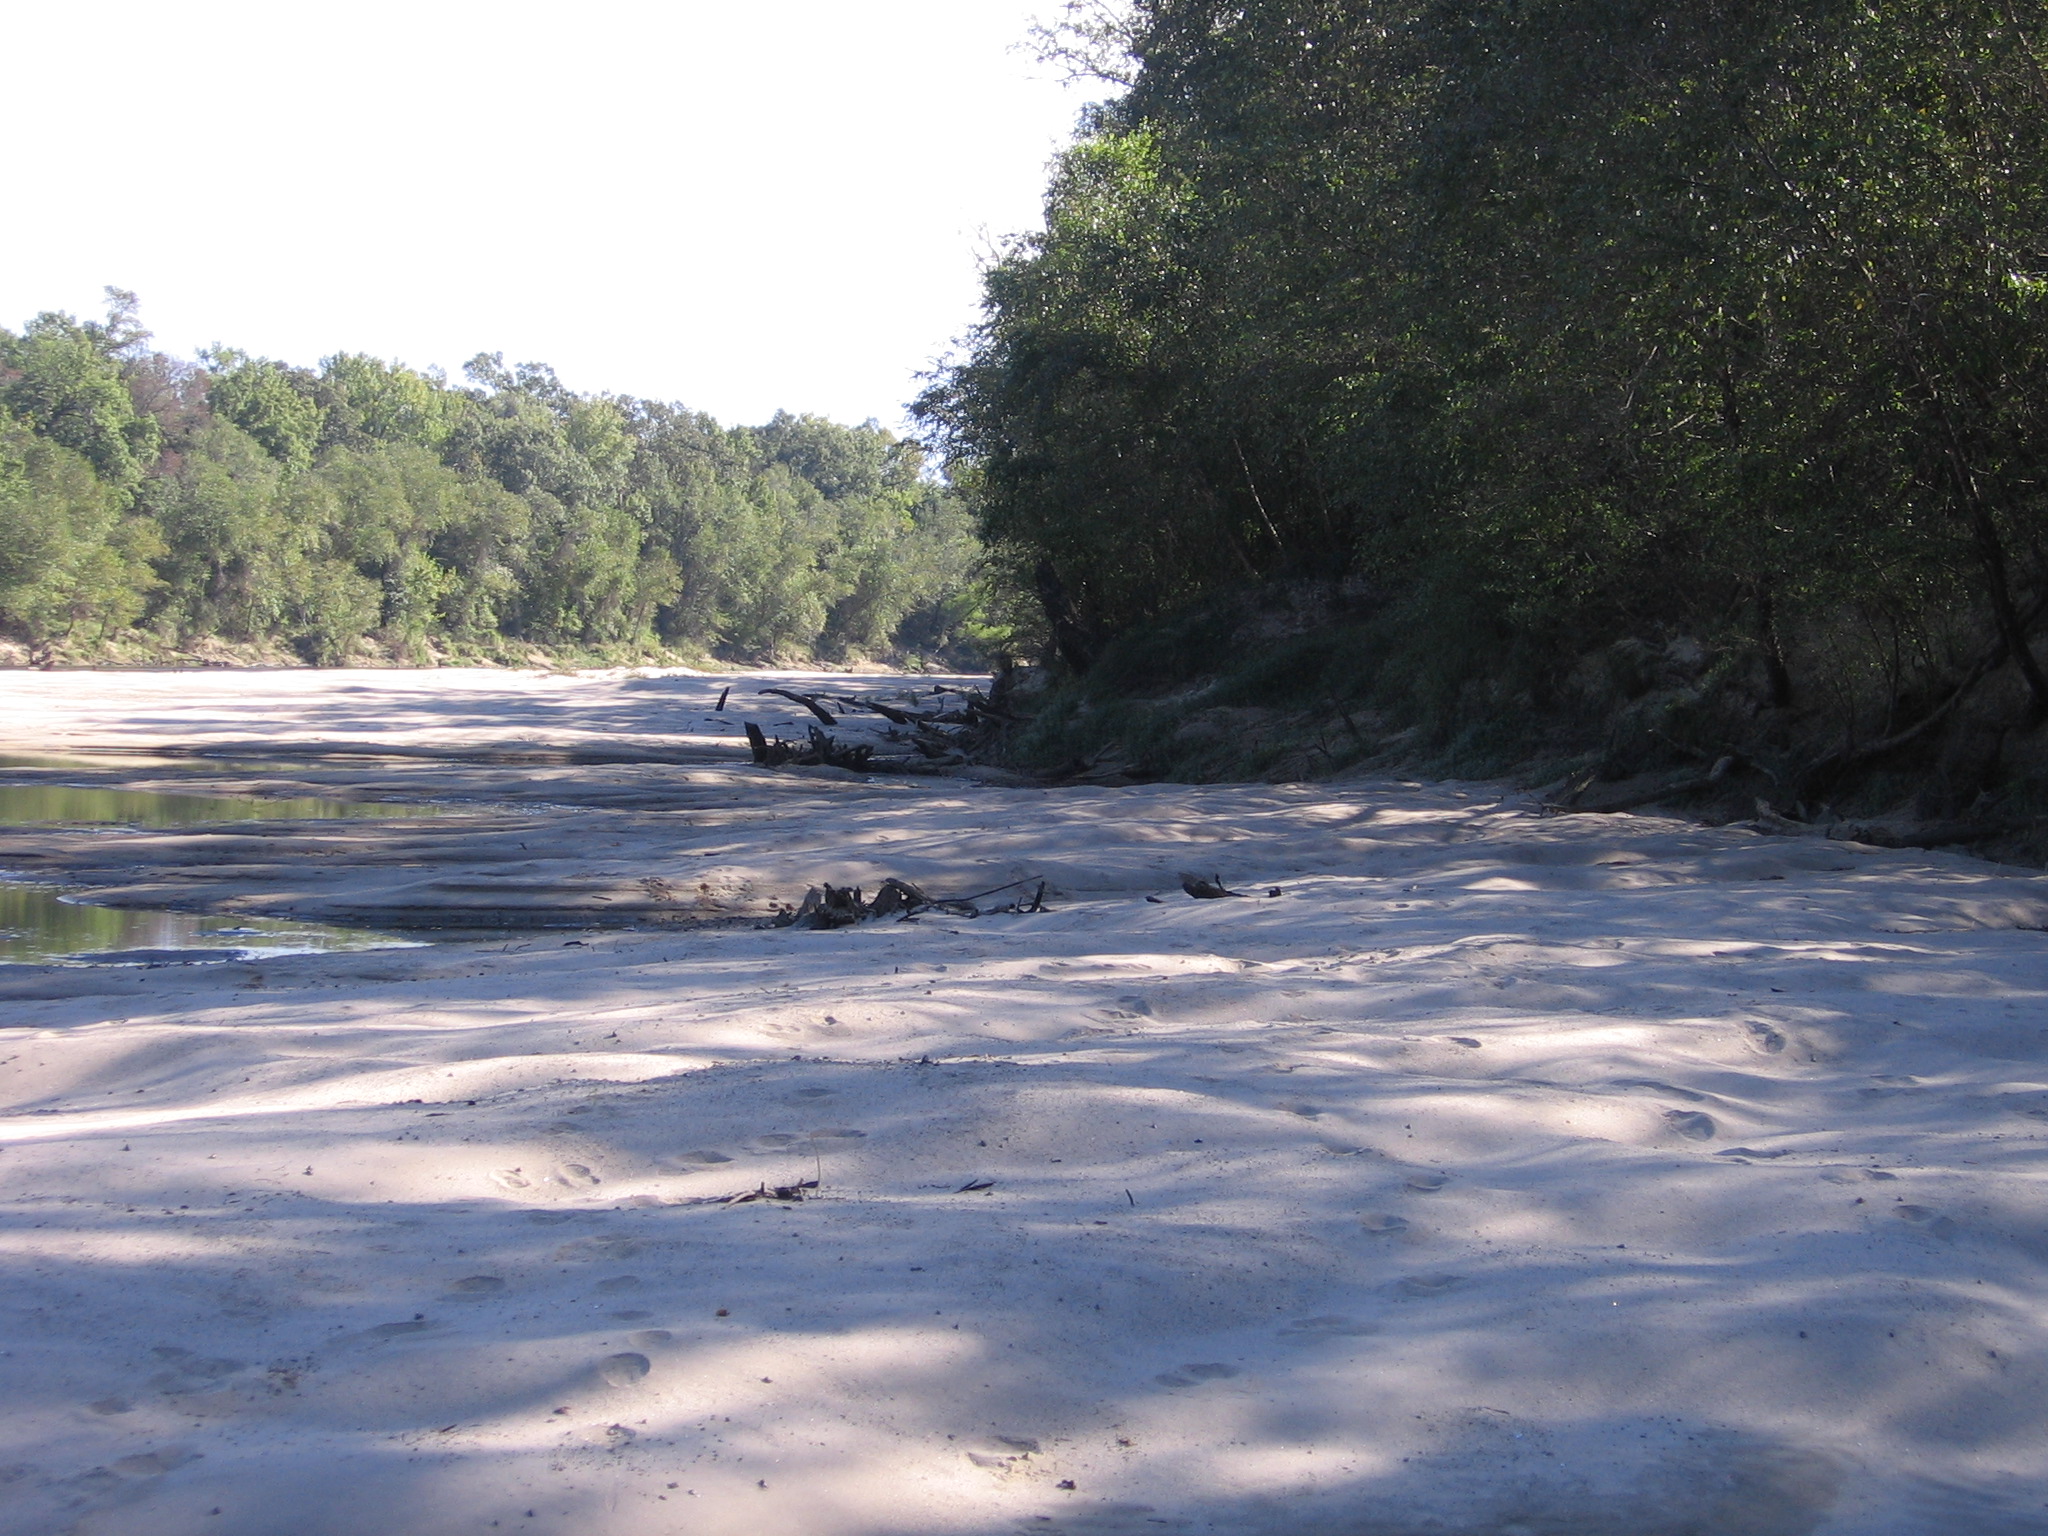
6. Resuspension of bottom sediments. Like many of the tidal creeks in the region, bottom sediments are a soft, low-density mixture of mud and organics often locally referred to as “gorp.” This material is easily resuspended by waves, currents, boats, and fauna—the bottom-hugging path of turtles or alligators is often marked by a cloudy trail of resuspended sediments. 

Soft bottom sediments exposed at low tide.

7. Organic matter. As in salt marshes in general, organic input from plant litter, which decomposes but slowly in the anerobic environment, is an important source—but not, of course, of mineral sediment. 

Autocyclic development?

Chauhan’s (2009) paper, Autocyclic erosion in tidal marshes, resurrects (Chauhan’s term) a notion that had been overwhelmed by our fixation on changes in terrestrial sediment supplies to coastal wetlands. Essentially, Chauhan (2009) shows that marshes often undergo cycles whereby fringe erosion releases sediment, which may then be redeposited elsewhere in the marsh. At any given time, a wetland will exhibit scarped edges of recent erosion, and emergent edges where marsh is being rebuilt by progradation. Though Chauhan’s field sites were in Europe, the North River marshes are consistent with this model. 

In the North River system, at low tide the maximum amount of resuspension of the benthic gorp occurs. In the shallow water, waves, turbulence, boat wakes, kayak paddles, and faunal activity stir up the sediments even more readily than at higher water levels. Much of the sediment is clay and organic matter with very low settling velocities, such that it remains suspended on the incoming tide and is delivered to the marsh surface at high tide. Even where the tidal inundation water does not become ponded so that sediment can settle out from suspension, the falling water when the ebb tide begins deposits a mud drape on the surface.

Regardless of where the sediment originally comes from, the mechanisms above are how most of it gets to the marsh surface. 

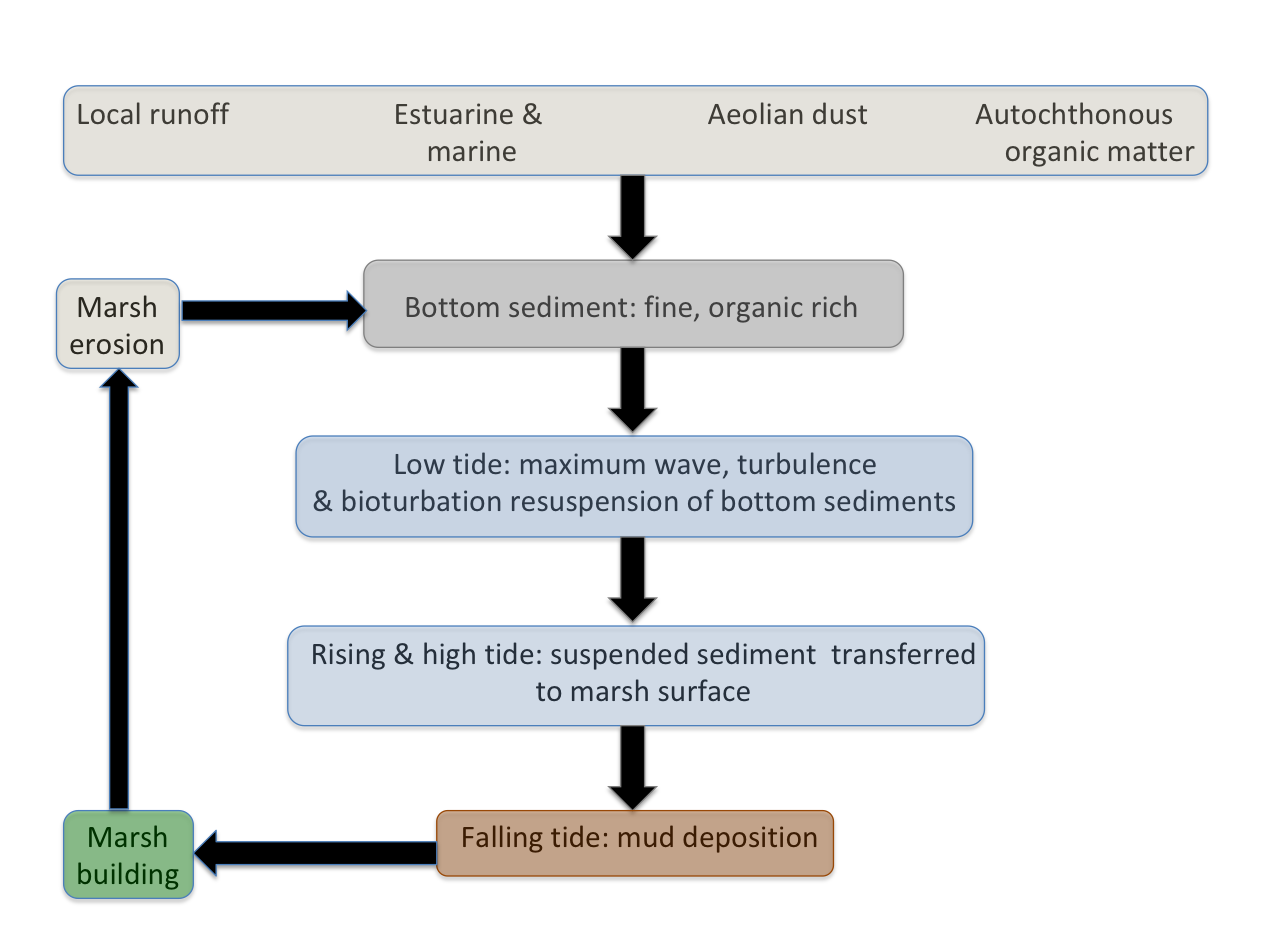
North River marsh sediment cycle.

In the discussion above, sources 1-4 are external, while 5-7 are internal. With respect to mineral sediment, bank erosion along the marshes and resuspension of bottom sediments are recycling or internally transferring sediment already delivered to the estuary/wetland system. Inland sources are irrelevant, and downstream-to-upstream transport of estuarine and marine sediment, some local inputs, and aeolian inputs all occur. The question is, how much, in both absolute and relative terms?

Sediment and sea-level

To keep pace with coastal submergence (eustatic sea-level rise plus any subsidence that may exist), wetlands must experience net surface accretion greater than or equal to the rate of coastal submergence. The extraordinarily high ecosystem services of coastal wetlands and their possible—and in many cases, ongoing—loss as sea-level rises are of clear and legitimate concern. We may be a bit too fixated on river contributions, however. 

For one thing, the notion that sediment trapping behind dams—which is definitely a thing—is robbing the coastal zone of its sediment supply is overstated in general and simply untrue in some cases. But even if/where/when that is the case, it could be argued that the dam diminution of downstream sediment loads is simply returning the sediment transport regime closer to what it was before widespread human-accelerated soil erosion. A similar argument applies to marshes that grew in response to 17th and 18th century land clearing in the U.S.—their reduction may be viewed as returning the regime to its pre-disturbance state (Kirwan et al., 2015). For another thing, many salt marshes are associated with non-fluvial settings or with small coastal watersheds with limited upland or inland drainage areas. 

Another complication is that the relationship between tides and sediment deposition can be quite complex. Ensign and others (2015), for example, found that the head of tide can be a bottleneck for fluvial sediment, be it sourced from near or far. If their results (from Maryland) apply to the North River, they point to estuarine sediment sources. Gunnell et al. (2013) report contemporary marsh building in the lower Newport River, where local estuarine and marine sediments are the only plausible source. 

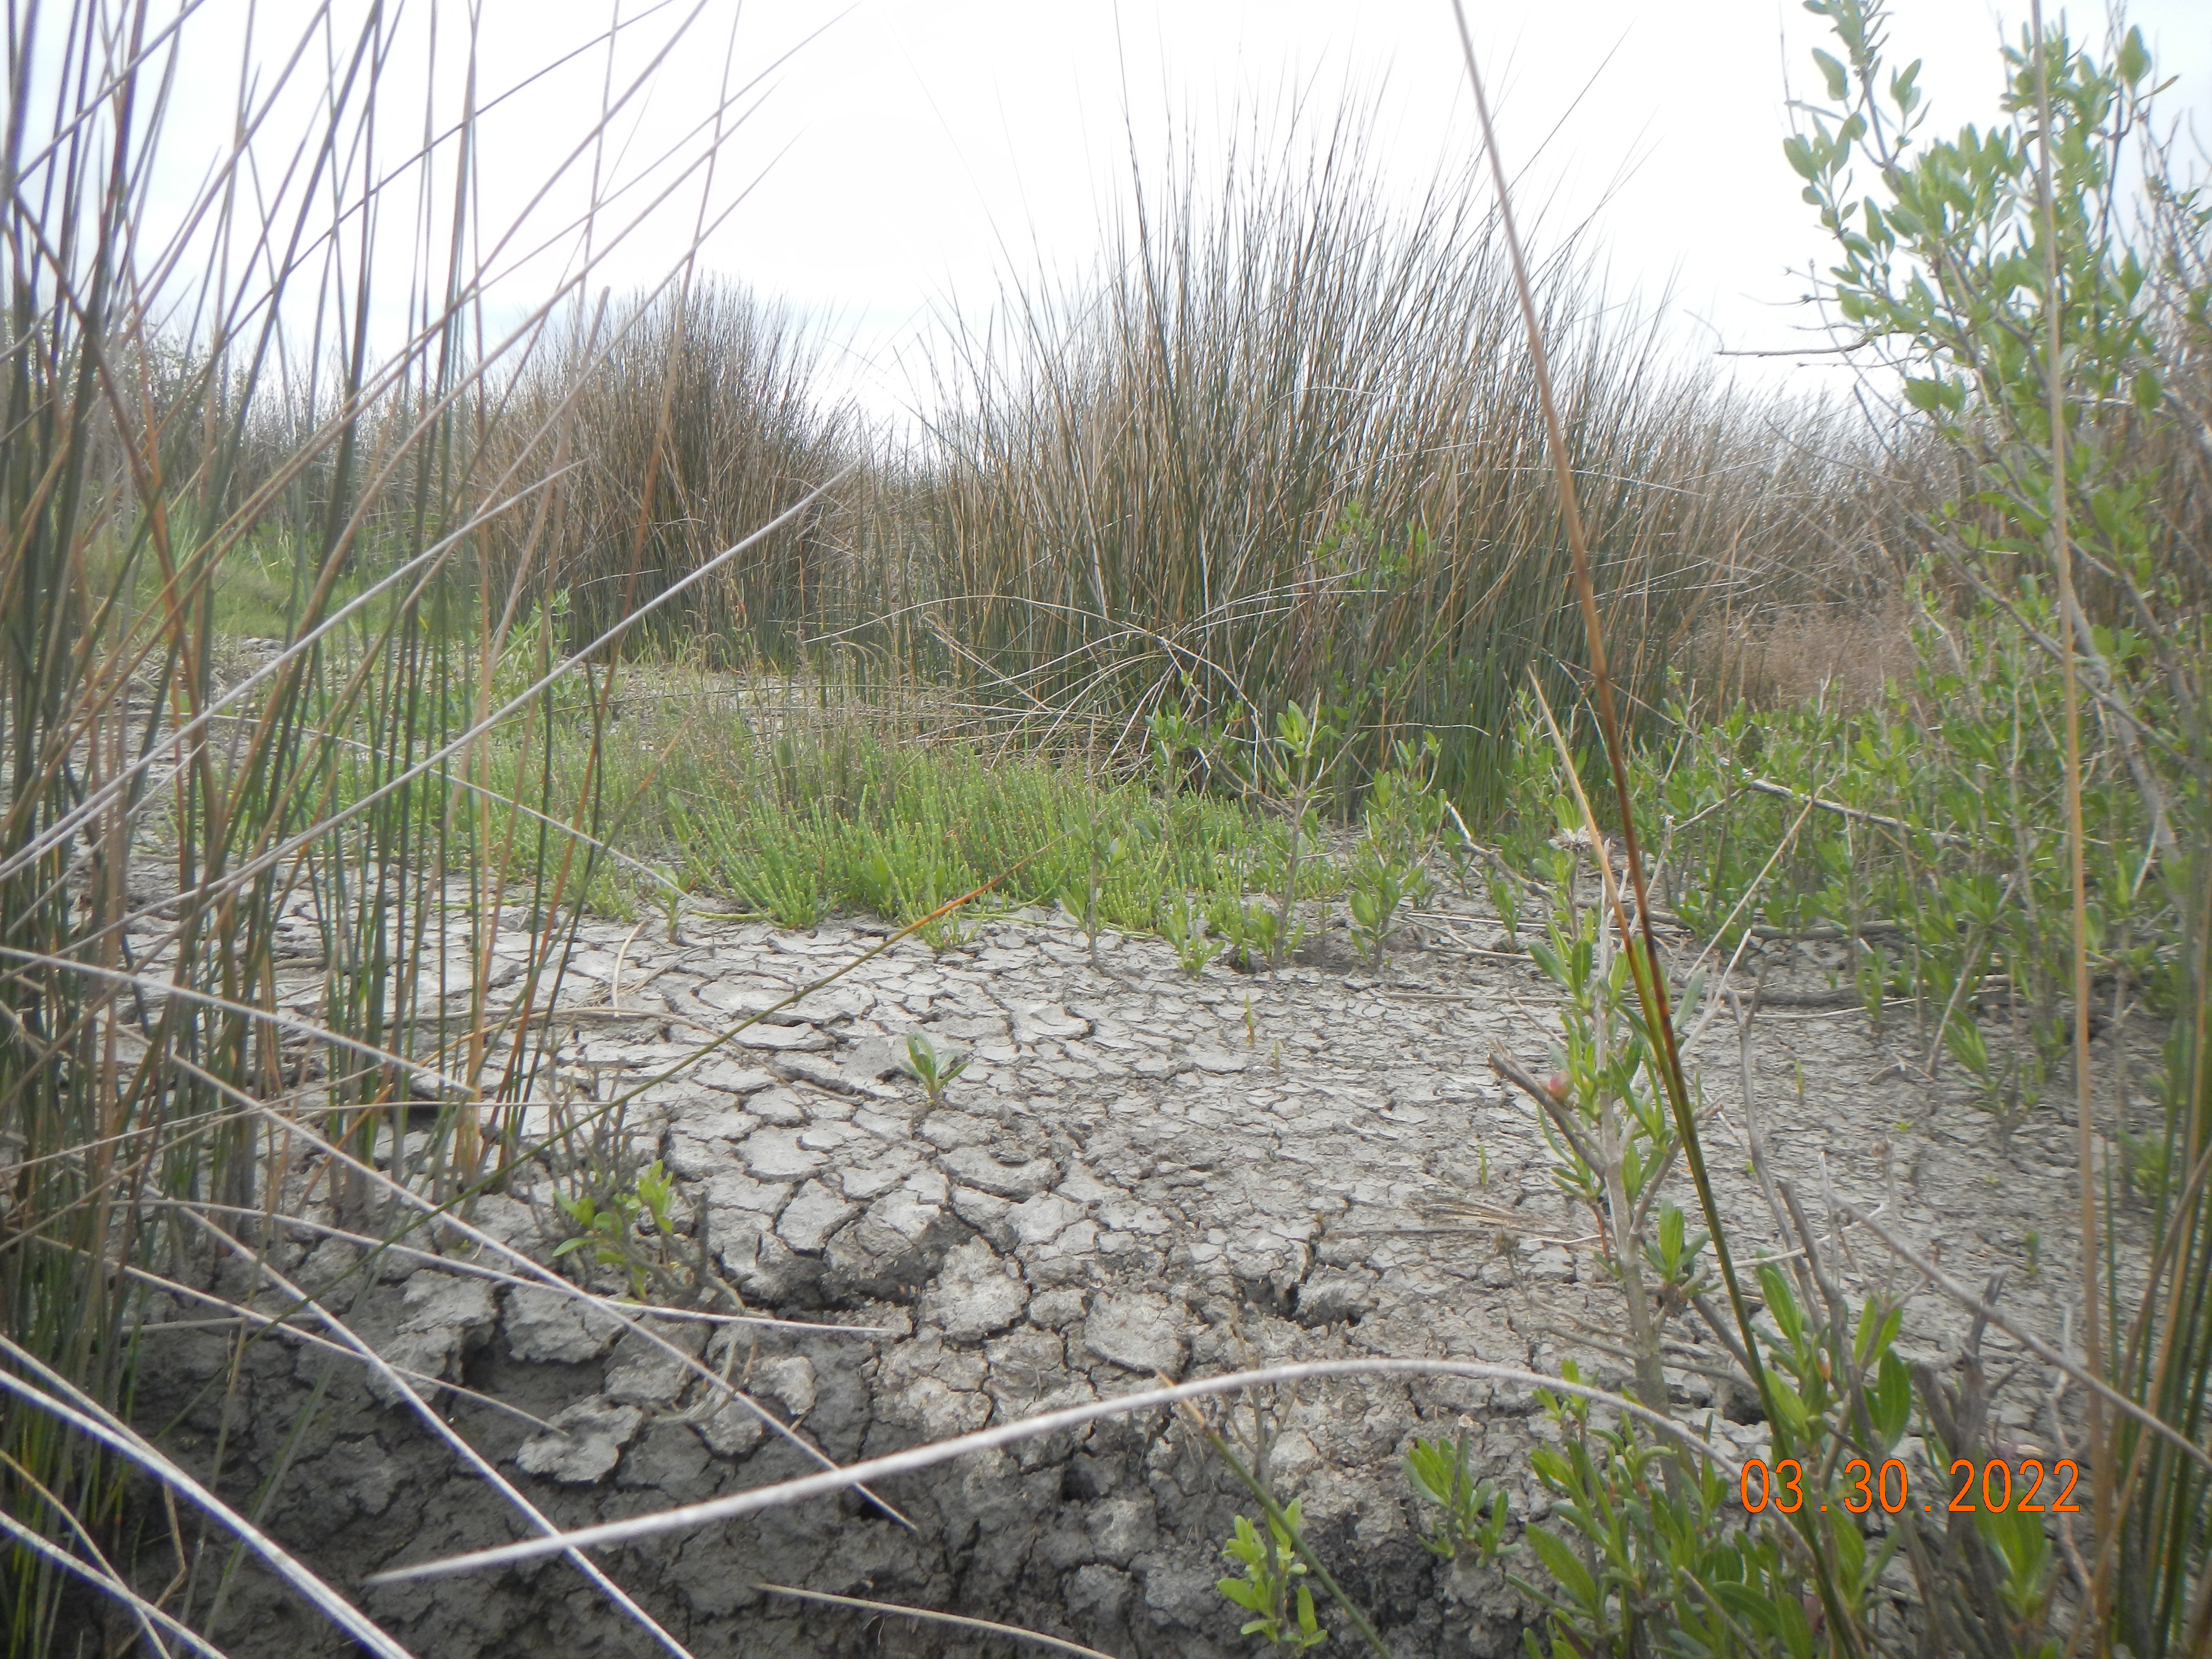
Salt pan, with saltwort (Salicornia Virginia) emerging.

It seems we have more work to do. Upland, inland sediment sources may or may not be important for salt marsh accretion, and in some cases are clearly not. And marsh erosion can occur due to internal feedbacks in the absence of coastal submergence (Chauhan, 2009; Mariotti and Fagherazzi, 2013), though in some cases an accretionary deficit is indeed the culprit. 

REFERENCES

Chauhan, P.P.S. 2009. Autocyclic erosion in tidal marshes. Geomorphology 110, 45-57. 

Cowart, L.; Corbett, D.R., and Walsh J.P., 2011. Shoreline change along sheltered coastlines: Insights from the Neuse River Estuary, NC, USA. Remote Sensing 3(7), 1516–1534. 

Cowart, L.; Walsh, J.P., and Corbett, D.R., 2010. Analyzing estuarine shoreline change: A case study of cedar island, North Carolina. Journal of Coastal Research 26(5), 817–830. 

Currin, C.A., Davis, J., Baron, L.C., et al. 2015. Shoreline change in the New River estuary, North Carolina: Rates and consequences. J. Coastal Research 31, 1069-1077. 

Darwin C. 1846. An account of the fine dust which often falls on vessels in the Atlantic Ocean. The Quarterly Journal of the Geological Society of London 2 (5, Part I), 26-30.

Ensign, S.H., Noe, G.B., Hupp, C.R., Skalak, K.J. 2015. Head-of-tide bottleneck of particulate material transport from watersheds to estuaries. Geophysical Research Letters 42, 10,671–10,679, doi:10.1002/ 2015GL066830. 


Gares, P.A., Slattery, M.C., Pease, P., Phillips, J.D. 2006. Eolian sediment transport on North Carolina Coastal Plain Agricultural Fields. Soil Science 171: 784-799. 

Gunnell, J.R., Rodriguez, A.B., McKee, B.A. 2013. How a marsh is built from the bottom up. Geology 41, 859-862, doi:10.1130/G34582.1 

Kirwan, M.L., Murray, A.B., Donnelly, J.P., Corbett, D.R. 2011. Rapid wetland expansion during European settlement and its implication for marsh survival under modern sediment delivery rates. Geology 39, 507-510. 

Mariotti, G., Fagherazzi, S. 2013. Critical width of tidal flats triggers marsh collapse in the absence of sea-level rise. PNAS 11o, 6353-5356. 

Mattheus, C.R., Rodriguez, A.B., McKee, B.A., 2009. Direct connectivity between upstream and downstream promotes rapid response of lower coastal-plain rivers to land-use change. Geophysical Research Letters 36, L20401. doi:10.1029/2009GL039995. 

Mattheus, C.R., Rodriguez, A.B., McKee, B.A., Currin, C.A. 2010. Impact of land use change and hard structures on the evolution of fringing marsh shorelines.  Estuarine, Coastal and Shelf Science 88, 365-376. 

Pease, P., Gares, P.A., Lecce, S.A. 2002. Eolian dust erosion from an agricultural field on the North Carolina coastal plain. Physical Geography 23, 381-400. 

Phillips, J.D., Slattery, M.C. 2006. Sediment storage, sea level, and sediment delivery to the ocean by coastal plain rivers. Progress in Physical Geography 30: 513-530.

Rodriguez, A.B., McKee, B.A., et al. 2020. Coastal sedimentation across North America doubled in the 20th century despite river dams. Nature Communications 11, 3249; doi.org/10.1038/s41467-020-16994-z |

Slattery, M.C., Phillips, J.D. 2010. Controls on sediment delivery in coastal plain rivers. Journal of Environmental Management 92: 284-289.

DEAD TREES AND LANDSCAPE FORMATION

Just published, in Ecosystems: Tree mortality may drive landscape formation: Comparative study from ten temperate forests. I am but one of 14(!) co-authors on this, but I've been involved in working out effects of trees on soils and landforms for 20 years. This study pulls together data from 10 protected forests and estimates the total volume of material affected by processes such as tree uprooting, and infilling of stump holes and decayed root channels, focusing on the differences between trees that die with their roots in the ground (eventually broken) vs. those that are uprooted. Uprooting-related soil volumes accounted annually for 0.01– 13.5 m3ha-1, reaching maximum values on sites with infrequent strong windstorms (European mountains). The redistribution of soils related to trees that died standing ranged annually between 0.17 and 20.7 m3ha-1 and were highest in the presence of non-stand-replacing fire (Yosemite National Park, USA). Comparing these results with long-term erosion rates indicates that tree effects may be a significant driver of landscape denudation.  The full abstract is given below.

Pavel Samonil (lead author of the study) examines at unrooted tree in eastern Kentucky.


THE LAW OF SCALE INDEPENDENCE

The Low of Scale Independence has just been published in the journal Annals of GIS (vol. 28, p. 15-29). The article is open-source, and the full text can be obtained here. The abstract is shown below. This artiicle represents a summary and synthesis of my thoughts and research on scale linkage over a period of more than 35 years.