
I am looking out on my rain-soaked yard in Craven County, NC, where it sure seems wetter than normal. Indeed, data from the nearby weather station in New Bern shows 90 mm of rain so far this month, and 1648 so far this year—the averages for Dec. 20 are 55 mm since Dec. 1, and 1309 for the year.
But this ain’t nothin’, really. The real story in these parts is the increased precipitation from tropical cyclones. The largest floods in memory in many locations in eastern NC occurred in conjunction with Hurricanes Florence in 2018, Matthew in 2016, and Floyd in 1999. At many locations these three represent, in on order or another, the 3 largest floods ever recorded. The key question being asked is whether this is the “new normal;” whether more frequent and/or more powerful storms and rainfall events (relative to say, the 20th century, are what we are going to get from now on. As one who suffered >$35K worth of uninsured water damage from Florence, I hope to hell not. But the evidence is not on my side.
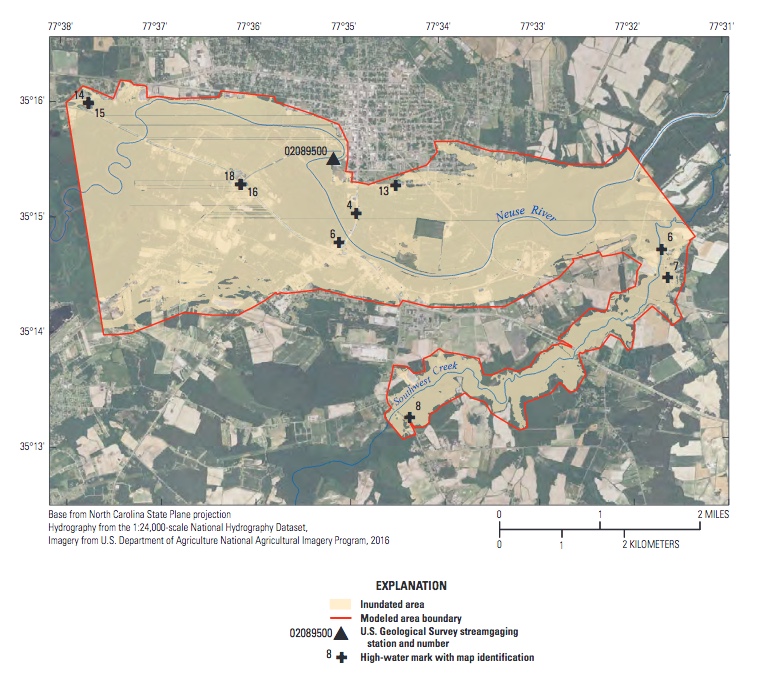
U.S. Geological Survey Flood inundation map for Kinston, NC (Neuse River) for hurricane Matthew in 2016.
The climate is warming. Warmer sea surface temperatures make it possible for tropical cyclones (some of which become hurricanes) to form, strengthen, and persist. This warmer air and water allow these storms to transport—and eventually release, in the form of rain—more water vapor. So, even though a lot of other factors influence the development and impacts of tropical cyclones, the core geophysical principles suggest more storms and more rain ahead.
Many studies have seen this coming. Easterling et al. (2017), for example, in a pre-Matthew and Florence analysis, projected average Atlantic tropical cyclone rainfall within 500 km of the storm center to increase by 8 to 17%. They wrote: ”The primary physical mechanism for this increase is the enhanced water vapor content in the warmer atmosphere, which enhances moisture convergence into the storm for a given circulation strength, although a more intense circulation can also contribute. Since hurricanes are responsible for many of the most extreme precipitation events in the southeastern United States, such events are likely to be even heavier in the future.”
And then Matthew, Florence and other storms proved them right—especially Hurricane Harvey, which struck the Texas coast in 2017, the largest rainfall event in U.S. history.
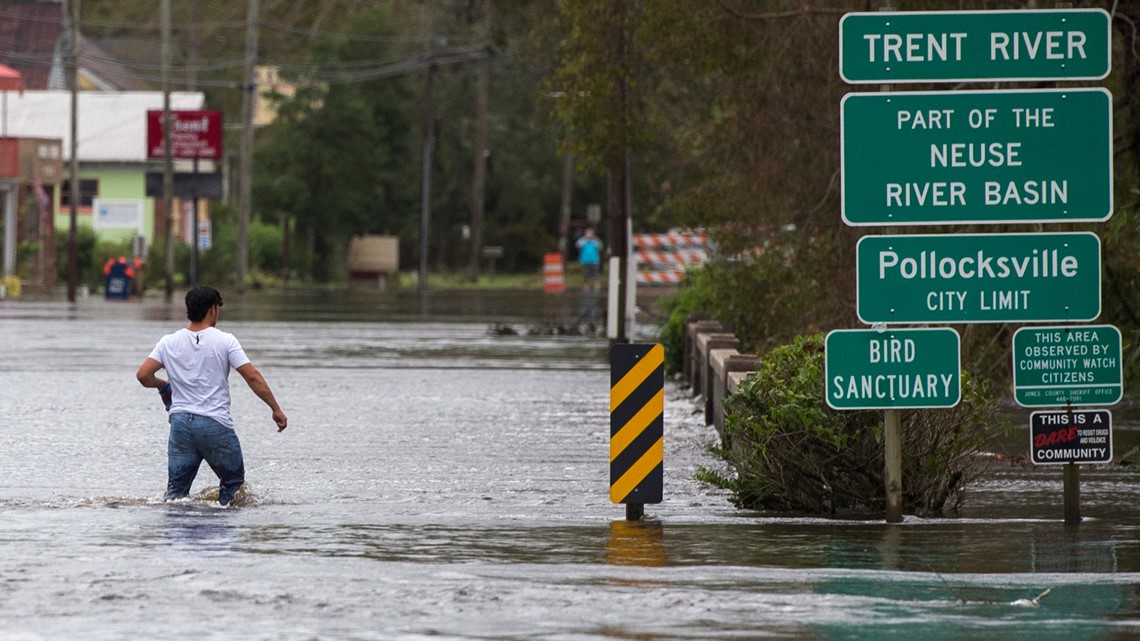
Flooding from Hurricane Florence , Pollocksville, NC. (Photo: WVEC, 13newsnow.com)
With respect to NC, Paerl et al. (2019) used standard calculation methods to suggest that there was only a 1.6% chance of the region having three precipitation events the size of Floyd, Matthew, and Florence in 20 years. This deviation from the historic record, and the standard reasoning about tropical cyclones, warming, and precipitation described above, led them to suggest that we have undergone a regime shift toward more extreme tropical cyclonic precipitation.
They, appropriately enough, used very conservative estimates of the probability (recurrence interval) of the storms. Leaving out Floyd, which differed from the other storms in that two other tropical cyclones had been through the region earlier in 1999, leaving wet soils and high flows before Floyd even got there, peak streamflows for Matthew and Floyd at multiple locations with 30 or more years of records were estimated to have a >500-year recurrence interval (0.2 percent probability in any given year; Weaver et al., 2016; Feaster et al., 2018). Using the same standard hydrological calculation methods as Paerl et al. (2019), the odds of having two 500-year events in three years are 0.0000358, or about 0.0036 percent.
All these estimates are all based on the idea that the long-term record is stationary--and those very low probabilities don’t prove, but do suggest, that it is not—that is, that we may have indeed reached a new normal.
These extreme runoff and streamflow events do not just have the well-known negative impacts of floods on people, property, and economies. These flows result in failures of sewage and storm drainage systems, washouts of hog waste lagoons, and a massive flushing of urban and agriculture runoff-borne pollutants into waterways.
And hydrological and water pollution effects are far from the only impacts of ongoing climate change. Several studies arising from the North Carolina Climate Science Report, for example, relate to health impacts in eastern N.C. and were published in the North Carolina Medical Journal. Dello et al. (2020), for example, noted that North Carolina has warmed by about 1°F over the past 120 years, which is actually less than Earth as a whole, which has warmed by nearly 2°F. 2019 was declared North Carolina’s warmest year in 125 years of record keeping, and the warming is expected to continue through this century. Nights have been getting hotter, Dello et al. (2020) found, though there is no historical trend in hot days. The years 2015-2019 had the warmest overnight low temperatures on record in NC, with 2019 setting the record for the warmest lows in the recorded past. These warm nights affect public health, specifically by creating conditions where the body cannot cool down after a high-temperature day. In the future, both days and nights are likely to get hotter. This increased heat, together with increases in humidity, present a public health risk.
Eastern North Carolina has a disproportionally higher percent of population groups that are vulnerable to the threats of climate change, Kearney et al. (2018) noted. They stressed the need for health care providers to understand and communicate the challenges faced by rural, vulnerable population groups, and of communicating these health risks to policy makers.
In a future post I’ll take a closer look at the Matthew and Florence events, and show that despite the extreme rainfall and flooding, they were in many respects not especially strong storms.
References
Dello, K., Robinson, W., Kunkel, K., et al. 2020. A hotter, wetter, more humid North Carolina. North Carolina Medical Journal 81, 307-310.
Easterling, D.R., K.E. Kunkel, et al., 2017: Precipitation change in the United States. Climate Science Special Report: Fourth National Climate Assessment, Volume I. Wuebbles, D.J., et al., Eds. U.S. Global Change Research Program, Washington, DC, USA, 207–230. http://dx.doi.org/10.7930/J0H993CC
Feaster, T.D., Weaver, J.C., Gotvald, A.J., Kolb, K.R. 2018. Preliminary Peak Stage and Streamflow Data at Selected Streamgaging Stations in North Carolina and South Carolina for Flooding Following Hurricane Florence, September 2018. U.S. Geological Survey Open-File Report 2018-1172.
Kearney, G.D., Jones, K., Bell, R.A., et al. 2018. Climate change and public health through lens or rural, eastern North Carolina. North Carolina Medical Journal 27, 270-277.
Paerl, H.W., Hall, N.S., Hounshell, A.G., et al. 2019. Recent increase in catastrophic tropical cyclone flooding in coastal North Carolina, USA: Long-term observations suggest a regime shift. Scientific Reports 9, 10620.
Weaver, J.C., Feaster, T.D., Robbins, J.C. 2016. Preliminary Peak Stage and Streamflow Data at Selected Streamgaging Stations in North Carolina and South Carolina for Flooding Following Hurricane Matthew, October 2016. U.S. Geological Survey Open-File Report 2016-1205.
Posted 21 December 2020
Questions or comments: jdp@uky.edu