
OH S#*T
Every day, it seems, there is another news story or reports of yet more evidence that the global climate is changing, either as we have predicted for years—or worse and faster. The climate system is incredibly complex, and climatologists, climate modelers and paleoclimatologists are furiously working to reduce the uncertainty. Despite the uncertainties and complexities, at this point it is clear that:
•Global mean temperatures are rising.
•Ocean heat content is increasing.
•Sea ice cover is, on average, decreasing (both in areal extent and thickness).
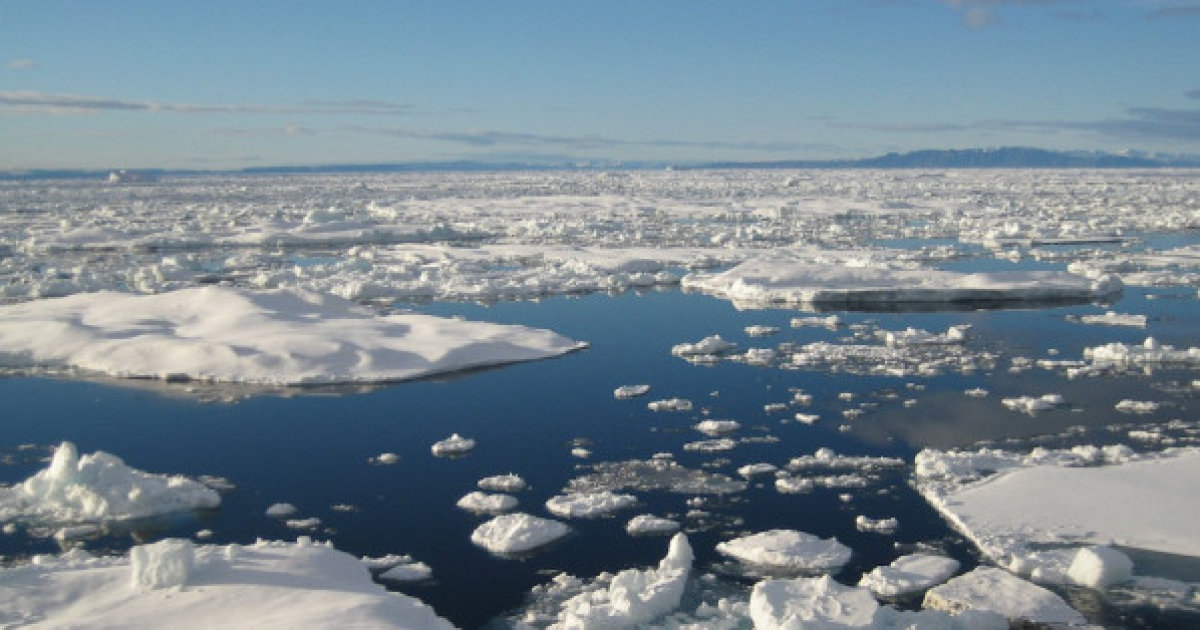
Arctic sea ice cover is in serious long-term decline (photo: Huffpost Canada)
•Ice sheets and glaciers are shrinking.
•Permafrost is thawing.
•Sea level is rising.
•Changes in climate-sensitive biota, ecosystems, and landforms are all consistent with a warming climate.
•The major driving force is a dramatic increase in heat-trapping greenhouse gases such as carbon dioxide and methane.
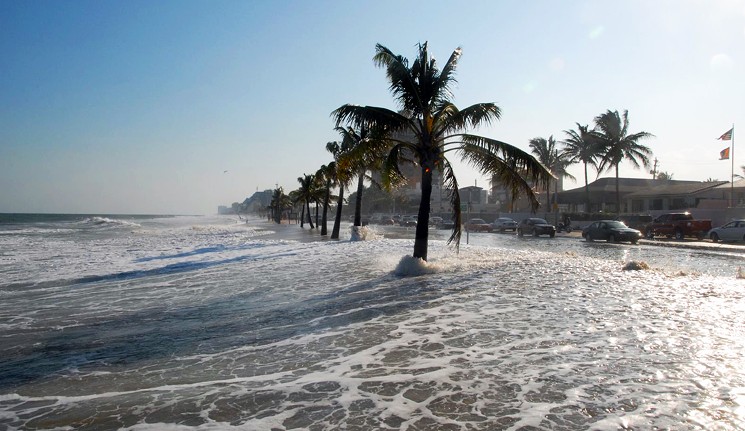
High water during a normal astronomical high tide in 2007; Ft. Lauderdale, Florida (photo: https://www.flickr.com/photos/d_himself/1848821193/)
When you look at some of the major feedbacks in the global climate system (which we’ll do shortly), many of them work so as to reinforce the warming trend, and increasingly the instrumental record and observed facts show that is exactly what’s happening.
So I decided to take a look at the problem—not to determine what is happening or has happened, or to predict climate change, or even to explore various scenarios. Rather, I am looking for a loophole—a pathway or event that could get us out of this doom-spiral, or a previously unheeded beacon of hope.
I approached this through a technique called qualitative stability modeling, one form of reduced complexity models. Despite our (scientific and societal) fetishism with quantification and numbers, qualitative modeling has advantages for some applications, chief of which is broader applicability. For example, a quantitative model may depend on, say, a specific quantitative relationship between sea surface temperature and tropical cyclone intensity, or between soil moisture content and wind erosion, both of which tend to be quite variable, depending on a variety of other factors that influence cyclogenesis and wind erosion. However, the qualitative relationships—other things being equal, higher sea surface temperatures lead to stronger storms and drier soil to more wind erosion, and vice versa—are universal. The idea of reduced complexity models is to (seek to) gain insight by paring a representation down to its crucial, critical elements. It is certainly a fact that the more variables or factors included in a model or representation, the less general it becomes(and vice versa).
So here goes. The model has five components—the atmospheric concentration of greenhouse gases (GHG), temperature, the extent of ice cover (land, sea, and permafrost), albedo, and sea level.
More GHGs (carbon dioxide and methane in particular) lead to higher temperatures. The physics of this have been well known since the 19thcentury, and the fact that it is happening on our planet is well established (and, from the paleoclimate record, it is clear that the direct positive relationship also works for lower greenhouse gas concentrations leading to lower temperatures). Higher temperatures result in thermal expansion of the oceans, and thus sea level rise. They also lead to loss of land and sea ice, the former of which also increases sea level.
Ice and snow have the highest albedo of any Earth surfaces, meaning that they reflect more and absorb less solar radiation—thus albedo has an inverse relationship with temperatures. Earth’s mean albedo is about 0.31 (on average, 31% of incoming solar radiation is reflected). Fresh snow is about 0.8, and up to 0.9. Sea ice has a typical albedo range of 0.5 to 0.7, and land ice of 0.4 to 0.8, depending on its age, how dirty it is, and how recently new snow may have been added.
By contrast, land surfaces have albedos of 0.1 to 0.4 (darker surfaces = lower albedo, and vice-versa). The open ocean has very low albedo, ranging generally from about 0.06 to 0.07 (albedo information: https://nsidc.org/cryosphere/seaice/processes/albedo.html)
Thus, when you reduce the cover of land ice and expose ground surfaces, you decrease albedo, increase solar radiation absorption, and increase temperatures. When you reduce sea ice and expose ocean water, you decrease albedo. When you raise sea level and cover ground surfaces with ocean, you decrease albedo.
You get the idea.
There is also the fact that thawing permafrost results in release of some carbon dioxide and (especially) methane to the atmosphere, the latter being more than 20 times better (or worse) at trapping heat than carbon dioxide, molecule for molecule.
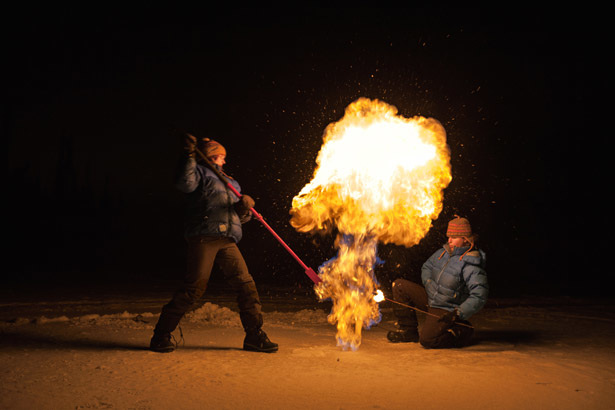
Flammable methane is stored in permafrost and released as permafrost thaws (https://allaboutmethane.weebly.com/chemical-properties-and-reaction-tendencies-of-methane.html).
The diagram shows how the pieces fit together. The arrows are defined on an other-things-being-equal basis. As I tell my students, other things are never equal. But the “other things,” the feedbacks, are meant to be accounted for by the other components and relationships.
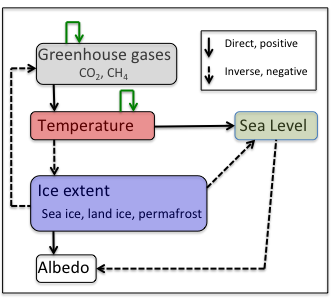
The green arrows in the figure represent the fact that there are other factors, not included in the model, that might either increase or decrease greenhouse gases or temperature. You could also add such arrows to the other model components, but these work mainly at a local rather than a global scale (for example, land subsidence strongly affects relative sea level in Louisiana, but not globally).
The stability of a model of this type can be determined using the Routh-Hurwitz criteria. To spare you the mathematical details (yes, a model can be both qualitative and mathematical), I have put them in the attached document RHA (for Routh-Hurwitz analysis). The RHA determines whether a system is dynamically stable, unstable, or conditionally stable. A stable system is resilient to relatively small perturbations, gradually damping them out and returning them toward the previously existing condition. Dynamical instability indicates sensitivity to minor disturbances, which tend to grow disproportionately large and last disproportionately long relative to the trigger disturbance. Conditional stability means the system may be stable or unstable depending on the relative strength of links connecting system components.
The bottom line is that the system shown here cannot be stable if factors external to the system work to increase greenhouse gases and/or temperatures. However, even if this is not the case, the RHA shows the model is dynamically unstable. This means that changes tend to persist and grow over time, and that the climate system is likely to continue to careen away from the norms that obtained through most of human history and prehistory.
Oh s#*t.
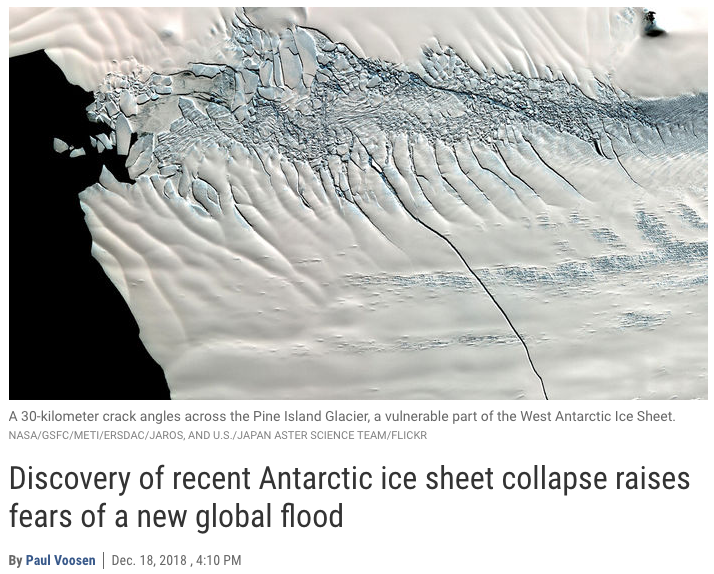
From Science Magazine.
The ray of hope is that it is indeed a dynamically unstable system. Thus the current state of increasing GHGs and temperatures, ice loss, albedo decline, and sea-level rise is also unstable, and thus perhaps vulnerable to changes—such as a serious human effort to not just reduce the growth of atmospheric GHGs, but bring them down, and perhaps other measures to reduce temperatures.
My conclusion (I hope I’m wrong but I fear I am right) is that we are already past the turning point, and that preparing for the consequences and engineering (not necessarily literally) another turning point are all we have left to do.
Posted 12 February 2019